Trends in historical mortgage rates
After years of sharp and unpredictable swings, mortgage rates have pulled back from their recent extremes. In early 2026, borrowing costs are lower than they were for much of the past few years, offering buyers some relief without returning to historic lows. Rates can still move with economic data and policy signals, but the market is no longer operating at peak pressure.
At the same time, home price growth has slowed and inventory has improved in many areas, easing affordability and giving buyers more room to plan and negotiate.
And remember: advertised mortgage rates are national averages. Borrowers with strong credit and solid finances may qualify for better terms, making it worthwhile to see where you stand rather than waiting for major market shifts.
In this article (Skip to...)
- Historical rate chart
- Average rates by year
- 30-year rate chart
- Historical rate perspective
- Will rates go back down?
- What affects your rate
- Other mortgage costs
Want to see our expert mortgage insights first?
Add The Mortgage Reports as a preferred source on Google. You’ll automatically see our latest rate analyses, buying guides, and housing forecasts highlighted in your Google Search, AI Mode, and AI Overviews.
Historical mortgage rates chart
Current rates are more than double their all-time low of 2.65% (reached in January 2021). But if we take a step back and look at the history of mortgage rates, they’re still close to the historic average.
Freddie Mac, the main industry source for mortgage rates, has been keeping records since 1971. Between April 1971 and February 2026, 30-year fixed-rate mortgages averaged 7.70%.
Find your lowest mortgage rate. Start hereTo understand today’s mortgage rates in context, take a look at where they’ve been throughout history.
Historical 30-year mortgage rates chart
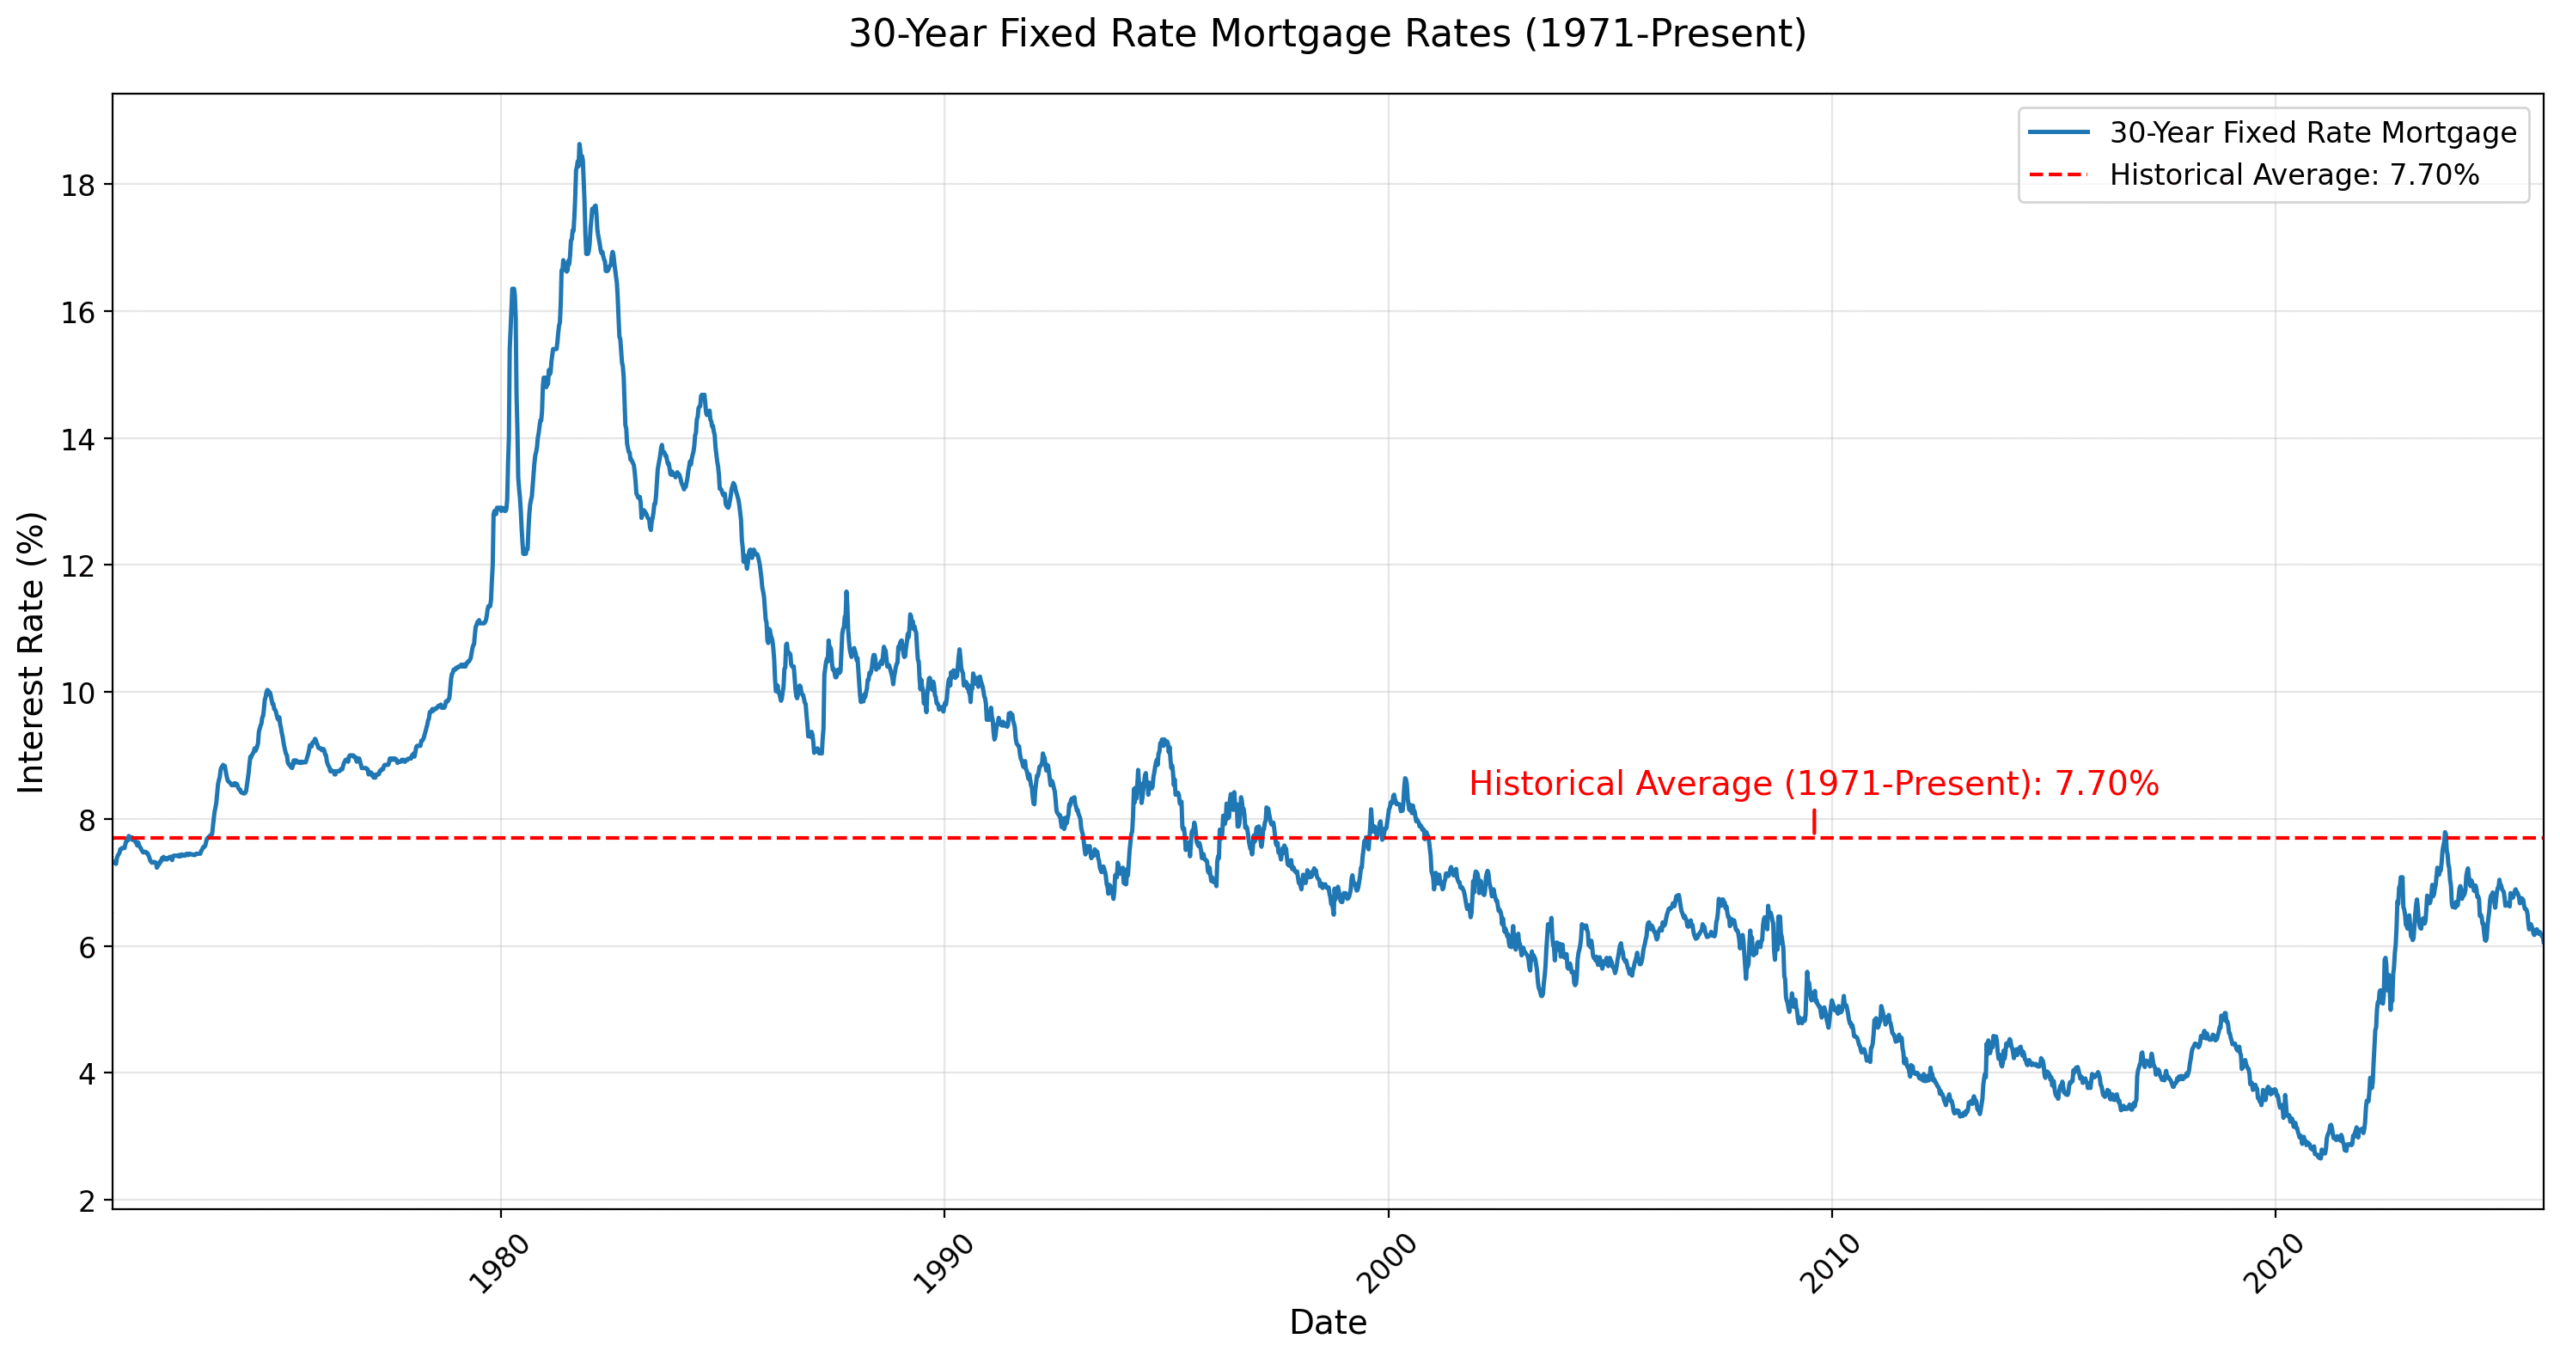
Chart represents weekly averages for a 30-year fixed-rate mortgage. Average for 1971-2026 as of February 20, 2026. Source: Freddie Mac PMMS. (c) TheMortgageReports.com
30-year fixed-rate mortgage trends over time
Understanding mortgage rates history helps frame current conditions and shows how today’s rates compare to the historic mortgage rates averages. Here’s how average 30-year rates have changed from year to year over the past five decades.
| Year | Average 30-Year Rate | Year | Average 30-Year Rate | Year | Average 30-Year Rate |
| 1978 | 9.64% | 1994 | 8.38% | 2010 | 4.69% |
| 1979 | 11.20% | 1995 | 7.93% | 2011 | 4.45% |
| 1980 | 13.74% | 1996 | 7.81% | 2012 | 3.66% |
| 1981 | 16.63% | 1997 | 7.60% | 2013 | 3.98% |
| 1982 | 16.04% | 1998 | 6.94% | 2014 | 4.17% |
| 1983 | 13.24% | 1999 | 7.44% | 2015 | 3.85% |
| 1984 | 13.88% | 2000 | 8.05% | 2016 | 3.65% |
| 1985 | 12.43% | 2001 | 6.97% | 2017 | 3.99% |
| 1986 | 10.19% | 2002 | 6.54% | 2018 | 4.54% |
| 1987 | 10.21% | 2003 | 5.83% | 2019 | 3.94% |
| 1988 | 10.34% | 2004 | 5.84% | 2020 | 3.10% |
| 1989 | 10.32% | 2005 | 5.87% | 2021 | 2.96% |
| 1990 | 10.13% | 2006 | 6.41% | 2022 | 5.34% |
| 1991 | 9.25% | 2007 | 6.34% | 2023 | 6.81% |
| 1992 | 8.39% | 2008 | 6.03% | 2024 | 6.72% |
| 1993 | 7.31% | 2009 | 5.04% | 2025 | 6.60% |
Source: Freddie Mac
Find your lowest mortgage rate. Start here
Historical mortgage rates trends: A look at the last few years
Mortgage interest rates hit historic lows below 3% during the COVID pandemic thanks to Federal Reserve emergency measures. But as the economy shifted, rates rose sharply.
By 2022, inflation surged, pushing rates to their highest levels in decades. Freddie Mac reported the average 30-year rate climbing from 3.22% in January 2022 to a peak of 7.08% in October—a dramatic increase in borrowing costs.
In 2023, hopes for relief faded as rates stayed elevated amid stubborn inflation and global uncertainty. The Fed slowed its pace of rate hikes, but mortgage rates remained volatile.
Through 2024, rates fluctuated frequently but without lasting improvement. The Fed issued several rate cuts, yet mortgage rates reacted only modestly, leaving many buyers still squeezed by high borrowing costs.
That backdrop made 2025’s three rate cuts to end the year especially significant. While not a dramatic drop, it helped reestablish a gentle downward trend and brought the clearest affordability gains buyers had seen in years. Policymakers remain cautious given inflation and geopolitical risks, but the shift has provided long-awaited stability.
Entering 2026, rates continue to ease modestly amid a mix of cooling inflation, cautious Fed policy, and new federal efforts aimed at lowering borrowing costs, including initiatives to support demand for mortgage-backed bonds. These moves may help reinforce the downward trend, but the broader path of mortgage rates will still depend on inflation progress and financial market conditions. The U.S. war on Iran and its ripple effects pushed rates back up in March.
Current 30-year mortgage rates chart
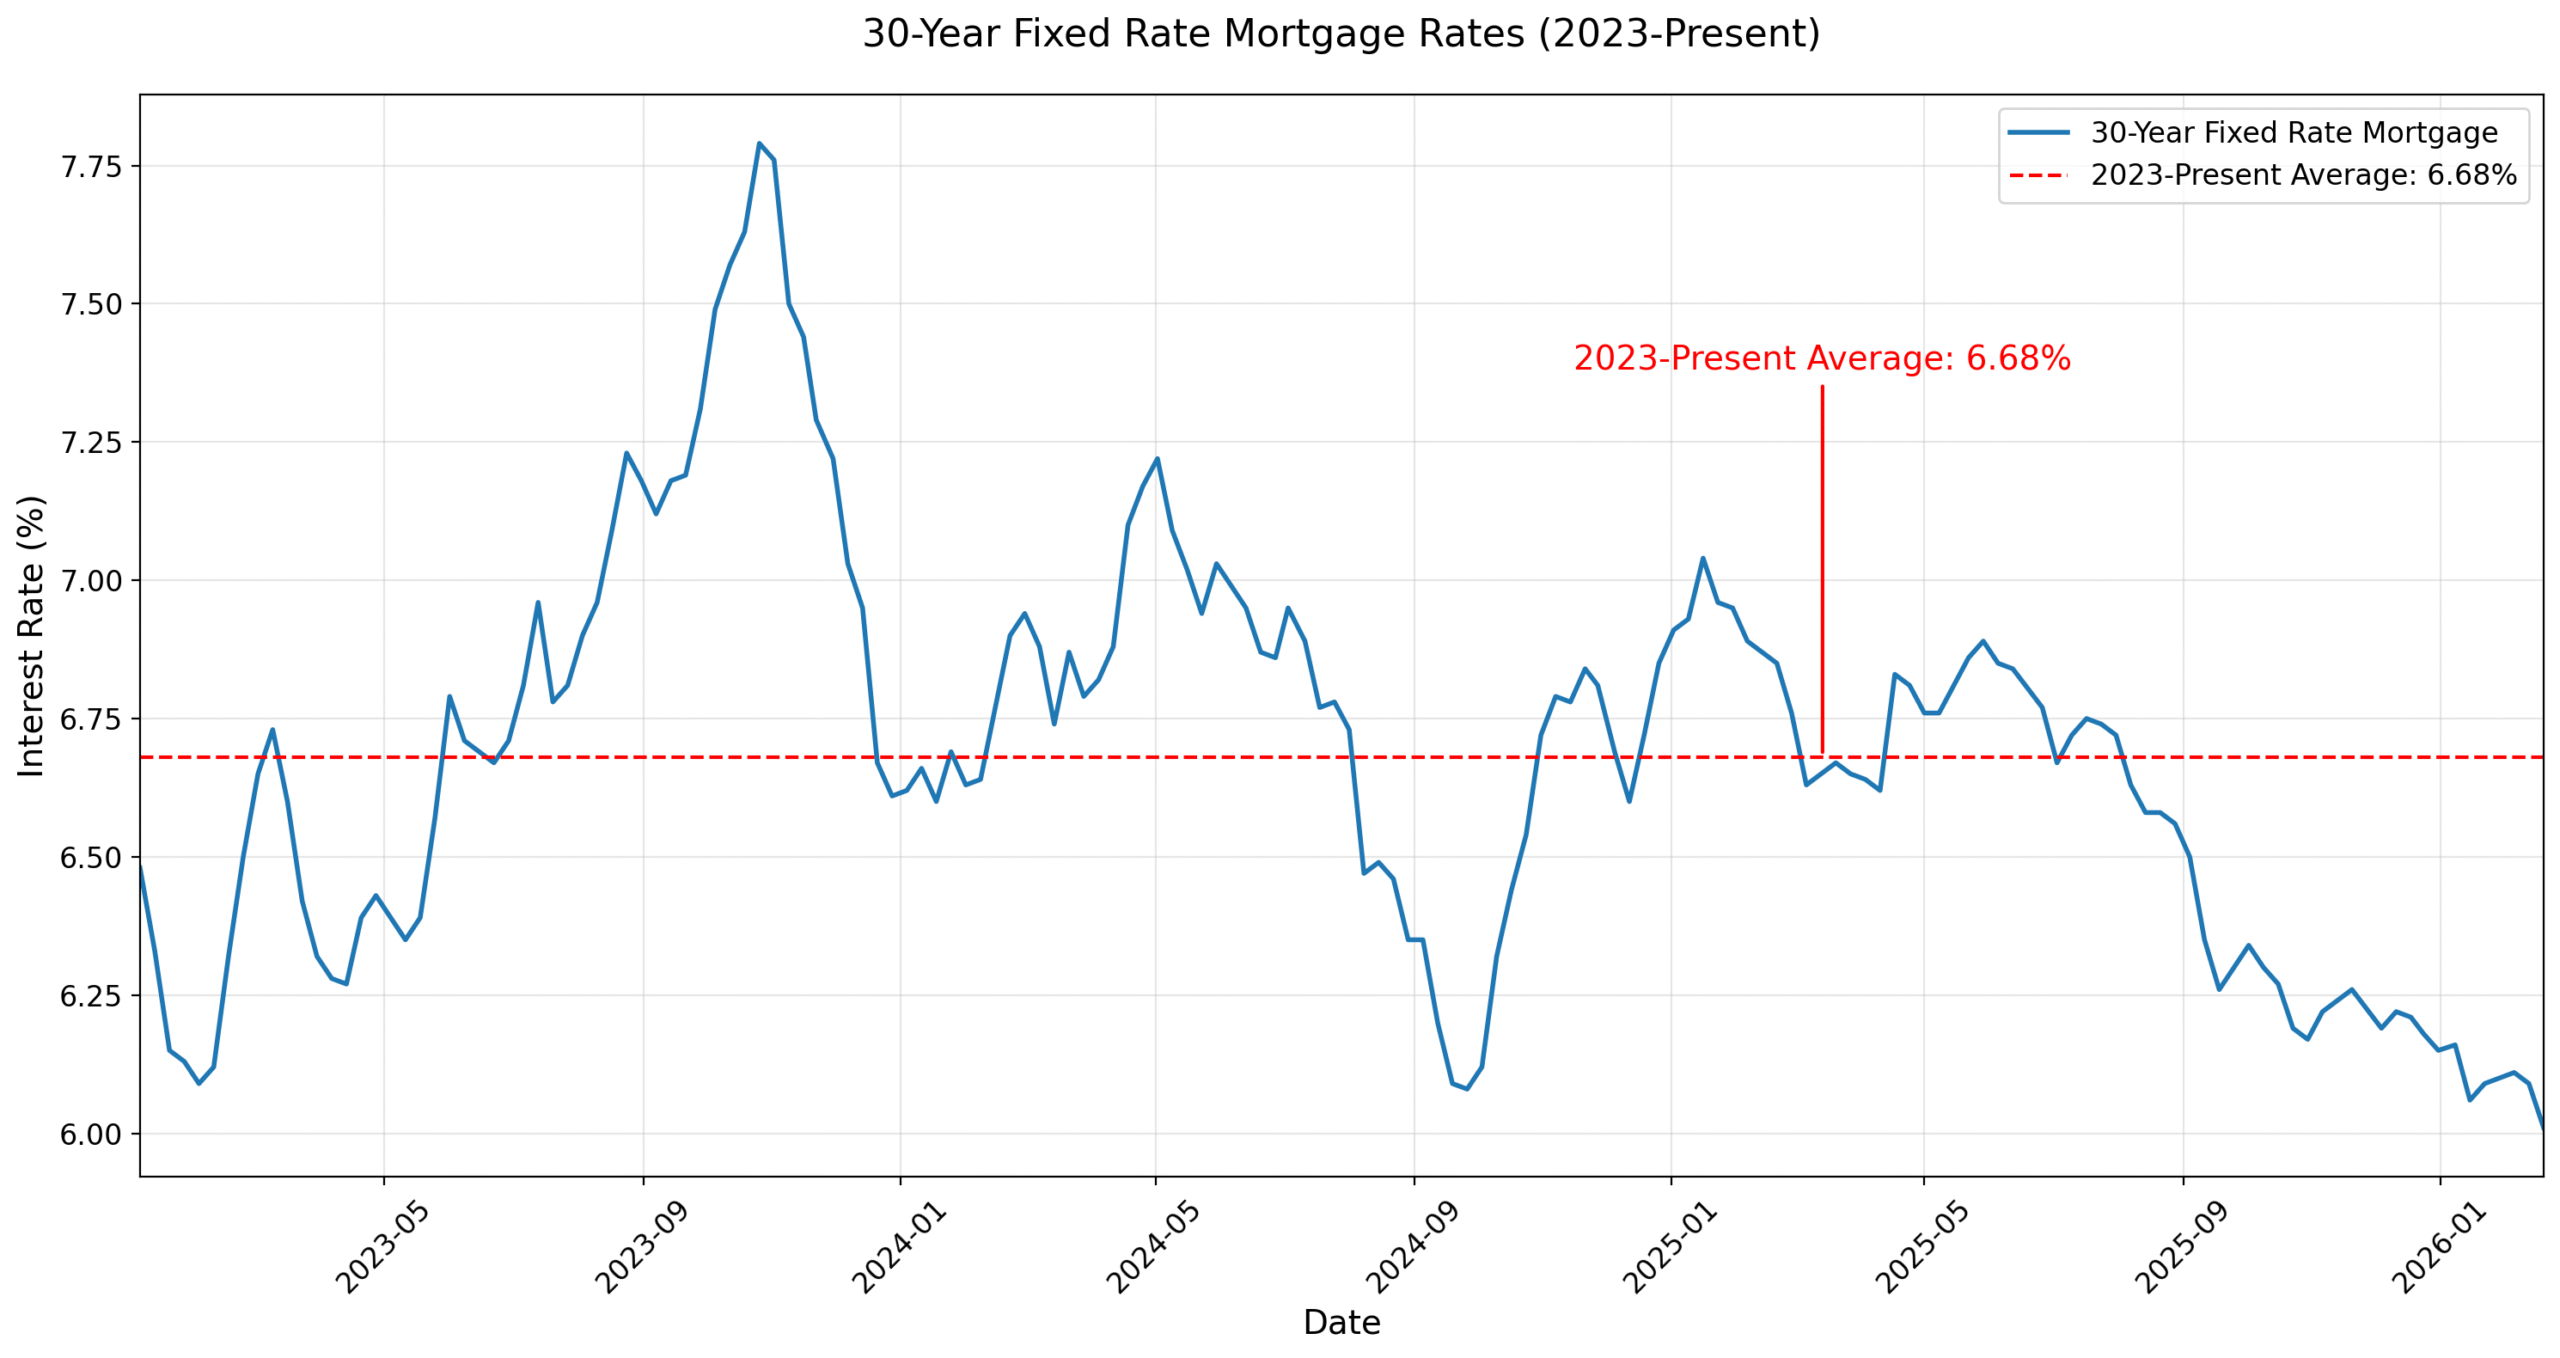
Chart represents weekly averages for a 30-year fixed-rate mortgage. Average for 2023-26 as of February 20, 2026. Source: Freddie Mac PMMS. (c) TheMortgageReports.com
Historic mortgage rates: Important years for rates
The long-term average for mortgage rates is just under 8 percent. That’s according to Freddie Mac records going back to 1971. But historical mortgage rates show that rates can fluctuate significantly from year to year. And some years have seen much bigger moves than others.
Let’s look at a few examples to show how rates often buck conventional wisdom and move in unexpected ways.
Find your lowest mortgage rate. Start here1981: The all-time high for mortgage rates
1981 was the worst year for mortgage interest rates on record.
How bad is bad? The average mortgage rate in 1981 was 16.63 percent.
- At 16.63%, a $200,000 mortgage has a monthly cost for principal and interest of $2,800
- Compared with the long-time average that’s an extra monthly cost of $1,300 or $15,900 per year
And that’s just the average — some people paid more. For the week of Oct. 9, 1981, mortgage rates averaged 18.63%, the highest weekly rate on record, and almost five times the 2019 annual rate.
2008: The mortgage slump
2008 was the final gasp of the mortgage meltdown. Real estate financing was available in 2008 for 6.03%, according to Freddie Mac.
- The monthly payment for a $200,000 mortgage was about $1,200, not including taxes and insurance
Post-2008, rates declined steadily.
2016: An all-time low for mortgage rates
Until recently, 2016 held the lowest annual mortgage rate on record since 1971. Freddie Mac says the typical 2016 mortgage was priced at just 3.65 percent.
- A $200,000 mortgage at 3.65% has a monthly cost for principal and interest of $915
- That’s $553 a month less than the long-term average
Mortgage rates had dropped lower in 2012, when one week in November averaged 3.31 percent. But some of 2012 was higher, and the entire year averaged out at 3.65% for a 30-year mortgage.
Find your lowest mortgage rate. Start here2019: The surprise mortgage rate drop-off
In 2018, many economists predicted that 2019 mortgage rates would top 5.5 percent. However, mortgage rates history shows that this forecast was off the mark. In fact, rates dropped in 2019. The average mortgage rate went from 4.54% in 2018 to 3.94% in 2019.
- At 3.94%, the monthly payment for a $200,000 home loan was $948
- That’s a savings of $520 a month — or $6,240 a year — when compared with the 8% long–term average
In 2019, it was thought mortgage rates couldn’t go much lower. But 2020 and 2021 proved that thinking wrong again.
Compare mortgage and refinance rates. Start here2021: The lowest 30-year mortgage rates ever
Rates plummeted in 2020 and 2021 in response to the Coronavirus pandemic. By July 2020, the 30-year fixed rate fell below 3% for the first time. And it kept falling to a new record low of just 2.65% in January 2021. The average mortgage rate for that year was 2.96%. That year marked an incredibly appealing homeownership opportunity for first-time homebuyers to enter the housing market. It also resulted in a surge in refinancing activity among existing homeowners, reflecting a notable moment in historical mortgage rates that reshaped the landscape for many.
- At 2.65%, the monthly payment for a $200,000 home loan is $806 not counting taxes and insurance
- You’d save $662 a month, or $7,900 a year, compared to the 8% long-term average
However, record-low rates were largely dependent on accommodating, Covid-era policies from the Federal Reserve. Those measures were never meant to last. And the more U.S. and world economies recover from their Covid slump, the higher interest rates are likely to go.
Check your mortgage eligibility. Start here2022: Surge in mortgage rates
Thanks to sharp inflation growth, higher benchmark rates, and a drawback on mortgage stimulus by the Fed, mortgage rates spiked in 2022.
According to Freddie Mac’s records, the average 30-year rate jumped from 3.22% in January to a high of 7.08% at the end of October. That’s an increase of nearly 400 basis points (4%) in ten months.
As the year concluded, the average mortgage rate went from 2.96% in 2021 to 5.34% in 2022. Although, if the Fed gets inflation in check or the U.S. enters a meaningful recession, mortgage rates could come back down somewhat.
Find your lowest mortgage rate. Start here2023: Mortgage rates and tug-of-war with inflation
As the Federal Reserve continues its battle against inflation and edges closer to reaching its 2% target, mortgage rates have continued to indirectly climb higher. Since the Federal Reserve began its rate hikes in March 2022, the benchmark interest rate has risen 5 percentage points.
According to Freddie Mac’s records, the average 30-year rate reached 6.48% during the initial week of 2023, increasing steadily to eventually land at 7.03% in December.
The question arises: where will mortgage rates ultimately settle next year? U.S. Federal Reserve officials expect to cut interest rates two times in 2024. This move could alleviate significant upward pressure on mortgage rates, potentially leading to a more substantial rate decline. We’ll have to wait and see if rates breach the much anticipated 6% mark in 2024.
2024: A year of ups and downs for mortgage rates
In 2024, mortgage rates saw considerable fluctuations, with a brief period of relief in the fall, but overall remained high, averaging around 6.7% for the year.
The Federal Reserve’s three rate cuts, in September, November and December, did not directly lead to a sustained decrease in rates, but they did help stabilize borrowing costs after a volatile stretch in early 2024.
Inflation continued to moderate, but progress was uneven, and the Fed signaled caution heading into 2025. That left homebuyers with measured optimism: conditions were improving, but any relief was expected to be gradual, not dramatic.
2025: A cautious year with a late turn in rates
For much of 2025, the average 30-year mortgage rate hovered near 6.6%—about the same as 2024’s 6.7% average and well above the long-term norm of 7.7%.
The outlook shifted in September, when the Federal Reserve delivered its first rate cut of the year, helping nudge mortgage rates meaningfully lower. Inflation remains above target and geopolitical risks persist, keeping policymakers measured, but the late-year decline has brightened buyer sentiment.
So far in 2026, affordability is showing clearer signs of improvement as borrowing costs ease, home price growth cools, and inventory continues to rebuild. Further progress, however, will depend on how inflation evolves and whether the Fed gains enough confidence to continue cutting rates in the months ahead.
Find your lowest mortgage rate. Start here
Will mortgage rates go back down?
Mortgage rates surged between 2022 and 2023 after the Federal Reserve launched its most aggressive tightening cycle since the early 1980s. The Fed delivered four consecutive 75-basis-point hikes in mid-2022 as inflation spiked. While the Fed doesn’t set mortgage rates directly, these moves pushed long-term borrowing costs sharply higher.
Find your lowest mortgage rate. Start hereBy late 2022, policymakers began slowing the pace of increases, raising the federal funds rate by 50 basis points in December rather than another 75-point hike. Throughout 2023, the Fed shifted to smaller, 25-point adjustments, signaling that the end of the tightening cycle was approaching.
The pivot finally came in 2024, when the Fed issued its first rate cut in September and followed with another by year’s end. Even so, mortgage rates didn’t fall dramatically at first—they hovered around 6.7% for most of the year, reflecting sticky inflation and cautious financial markets.
Entering 2025, most forecasters expected rates to move gradually lower. The MBA and NAR projected 30-year averages in the mid-6% range, which proved accurate through the first half of the year as rates sat near 6.76% in early May. Momentum improved after the Fed delivered cuts in September, October, and December, helping mortgage rates trend closer to those forecasts.
Now in 2026, the narrative has added a new policy element. Leadership changes at the Federal Reserve have introduced some uncertainty around the future path of rates, as markets assess whether the new Fed Chair will lean more toward growth support or continued inflation control.
At the same time, the federal government moved to purchase $200 billion in mortgage-backed securities to boost demand for mortgage bonds and help nudge borrowing costs lower. While this step contributed to recent declines and increased refinance activity, experts caution its long term impact is likely modest relative to broader market forces.
Most forecasts still point to incremental declines rather than a rapid return to historic lows. Inflation has cooled, but leadership changes, global economic risks, and geopolitical conflicts continue to influence long term rates.
For buyers, the takeaway is simple: rates are easing, but gradually and with added policy uncertainty. Buying when you are financially ready and refinancing later if rates fall further remains the more practical strategy.
Factors that affect your mortgage interest rate
For the average homebuyer, tracking historical mortgage rates helps reveal trends. But not every borrower will benefit equally from today’s competitive mortgage rates.
Home loans are personalized to the borrower. Your credit score, down payment, loan type, loan term, and loan amount will affect your mortgage or refinance rate.
It’s also possible to negotiate mortgage rates. Discount points can provide a lower interest rate in exchange for paying cash upfront.
Find your lowest mortgage rate. Start hereLet’s look at some of these factors individually:
Credit score
A credit score above 720 will open more doors for low-interest-rate loans, though some loan programs such as USDA, FHA, and VA loans can be available to sub-600 borrowers.
If possible, give yourself a few months or even a year to improve your credit score before borrowing. You could save thousands of dollars through the life of the loan.
Down payment
Higher down payments can shave your borrowing rate.
Most mortgages, including FHA loans, require at least 3 or 3.5% down. And VA loans and USDA loans are available with zero down payment. But if you can put 10, 15, or even 20% down, you might qualify for a conventional loan with low or no private mortgage insurance and seriously reduce your housing costs.
Loan type
The type of mortgage loan you use will affect your interest rate. However, your loan type hinges on your credit score. So these two factors are very intertwined.
For example, with a credit score of 580, you may qualify only for a government-backed loan such as an FHA mortgage. FHA loans have low interest rates, but come with mortgage insurance no matter how much money you put down.
A credit score of 620 or higher might qualify you for a conventional loan, and — depending on your down payment and other factors — potentially a lower rate.
Adjustable-rate mortgages traditionally offer lower introductory interest rates compared to a 30-year fixed-rate mortgage. However, those rates are subject to change after the initial fixed-rate period. An initially low ARM rate could rise substantially after 5, 7, or 10 years.
Loan term
In this post we’ve tracked rates for 30-year fixed-rate mortgages. But 15-year fixed-rate mortgages tend to have even lower borrowing rates.
With a 15-year mortgage, you’d have a higher monthly payment because of the shorter loan term. But throughout the life of the loan you’d save a lot in interest charges.
If you took out a $400,000 home loan with a 30-year fixed rate of 6.75%, you’d pay around $533,981 in total interest over the life of the loan. The same loan size with a 15-year fixed rate of just 5.75% would cost only $207,577 in interest, saving you around $326,404 in total.
Loan amount
Rates on unusually small mortgages — a $50,000 home loan, for example — tend to be higher than average rates because these loans are less profitable to the mortgage lender.
Rates on a jumbo mortgage are normally higher, too, because mortgage lenders have a higher risk of loss. But jumbo loan rates have reversed course and stayed below conforming rates in 2025, creating great deals for jumbo loan borrowers. Currently, a jumbo mortgage is any loan amount over $832,750 in most parts of the U.S.
Discount points
A discount point can lower interest rates by about 0.25% in exchange for upfront cash. A discount point costs 1% of the home loan amount.
For a $400,000 loan, a discount point would cost $4,000 upfront. However, the borrower would recoup the upfront cost over time thanks to the savings earned by a lower interest rate.
Since interest payments play out over time, a buyer who plans to sell the home or refinance within a couple of years should probably skip the discount points and pay a higher interest rate for a while.
Some rate quotes assume the home buyer will buy discount points, so be sure to check before closing on the loan.
Find your lowest mortgage rate. Start here
Other mortgage costs to keep in mind
Remember that your mortgage rate is not the only number that affects your mortgage payment.
When you’re estimating your home buying budget, you also need to account for:
- Down payment
- Closing costs
- Discount points (optional)
- Private mortgage insurance (PMI) or FHA mortgage insurance premiums
- Homeowners insurance
- Property taxes
- HOA dues (if buying in a homeowners association)
When you get pre-approved, you’ll receive a document called a Loan Estimate that lists all these numbers clearly for comparison. You can use your Loan Estimates to find the best overall deal on your mortgage — not just the best interest rate.
You can also use a mortgage calculator with taxes, insurance, and HOA dues included to estimate your total mortgage payment and home buying budget.
When to lock your mortgage rate
Keep an eye on daily rate changes. But if you get a good mortgage rate quote today, don’t hesitate to lock it in.
Remember that average mortgage rates are only a general benchmark. If you have good credit and strong personal finances, there’s a good chance you’ll get a lower rate than what you see in the news. So check with a lender to see what you qualify for.
Time to make a move? Let us find the right mortgage for you