Key Takeaways
- It’s cheaper to buy a home instead of rent in the majority of U.S. counties
- The Midwest and South typically favors home buying
- The West is almost exclusively cheaper for renters
Buying versus renting is an age-old question in housing.
Affordability drives that answer for most people and it is cheaper to buy a home than rent in the majority of the U.S. in 2026, according to a report from Attom. However, it also showed property values growing at a faster pace than rental prices overall.
But in typical real estate fashion, it’s all about location. See where it’s more affordable to buy a home and where it’s better to rent across the country.
Advantage: home buyers
Whether you should buy or rent a house depends on several personal and financial factors. Though money does typically determine someone’s options — and not having enough saved for a down payment usually stands as the biggest obstacle between signing another lease and starting your home equity clock.
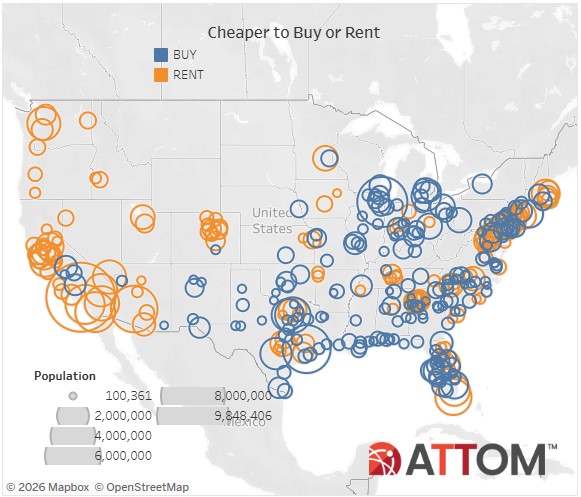
House hunters have good news in 2026. It’s cheaper to buy a home versus renting one in 57.7% of U.S. counties, according to Attom’s Rental Affordability Report. It showed homeownership expenses took up less of the average local wage than renting for 3-bedroom units in 210 of the 364 counties with enough data to analyze (assuming a 20% down payment, average mortgage rates, property taxes, and homeowner’s insurance).
Generally, the most affordable places for buyers came across the Midwest and South, while it’s almost exclusively cheaper to rent all along the West:
The cheapest housing markets to buy a home
The table below shows the 20 most affordable counties for home buying, with the lowest average local wage share needed to own a median-priced 3-bedroom house.
| County | State | Home buying share of average wages | Renting share of average wages | Annual home price growth | Median sales price | Annual rental price growth | Average monthly rent |
| Peoria | Illinois | 14.5% | 22.4% | 3.1% | $ 134,000 | -5.3% | $ 1,320 |
| Wayne | Michigan | 14.9% | 21.3% | 6.5% | $ 165,000 | 0.0% | $ 1,350 |
| Mobile | Alabama | 15.1% | 29.0% | -4.5% | $ 150,000 | 7.2% | $ 1,496 |
| Jefferson | Alabama | 16.3% | 20.2% | 14.2% | $ 179,900 | -7.7% | $ 1,200 |
| Montgomery | Alabama | 16.7% | 24.0% | 13.6% | $ 164,687 | 3.6% | $ 1,243 |
| Saint Louis City | Missouri | 17.3% | 28.2% | 4.5% | $ 202,067 | 4.7% | $ 1,832 |
| Jefferson | Texas | 17.4% | 23.7% | 4.1% | $ 174,250 | 1.1% | $ 1,387 |
| Delaware | Indiana | 18.0% | 29.0% | 5.9% | $ 143,000 | 5.0% | $ 1,260 |
| Richmond | Georgia | 18.4% | 29.6% | -1.2% | $ 163,000 | 4.4% | $ 1,462 |
| Bibb | Georgia | 18.8% | 26.7% | 7.9% | $ 159,900 | -1.1% | $ 1,236 |
| Comanche | Oklahoma | 18.9% | 29.3% | 7.4% | $ 150,369 | 25.4% | $ 1,285 |
| Calcasieu | Louisiana | 19.4% | 27.0% | 4.4% | $ 188,000 | 9.0% | $ 1,362 |
| Caddo | Louisiana | 19.6% | 25.2% | 7.3% | $ 164,900 | -4.2% | $ 1,198 |
| Clayton | Georgia | 19.7% | 26.4% | -5.0% | $ 216,000 | -3.2% | $ 1,674 |
| Shelby | Tennessee | 19.8% | 22.1% | 12.3% | $ 193,700 | -5.6% | $ 1,298 |
| Lucas | Ohio | 19.9% | 24.1% | 11.7% | $ 166,000 | 3.3% | $ 1,238 |
| Allegheny | Pennsylvania | 20.2% | 24.9% | 4.5% | $ 221,500 | 3.2% | $ 1,600 |
| Sangamon | Illinois | 20.4% | 23.2% | 9.3% | $ 186,310 | 0.2% | $ 1,353 |
| Cuyahoga | Ohio | 20.5% | 24.2% | 5.8% | $ 201,000 | 1.4% | $ 1,471 |
| Hinds | Mississippi | 21.5% | 24.8% | 25.0% | $ 197,018 | 7.5% | $ 1,236 |
Among the 44 counties with populations of at least 1 million, Wayne County, Mich., led the way with a 14.9% share of wages for home buying. Allegheny, Pa., came next at 20.2%, followed by Cuyahoga, Ohio (20.5%), Harris, Texas (24.1%), and Duval, Fla., (27.7%).
Check your home buying options. Start herePlaces with the smallest home price gains
The pace of property value growth normalized since the historical peaks earlier this decade. Annualized home price growth ranged by 33 percentage points by county, according to the report, with 74 of the 364 regressing year-over-year.
Prices dropped most in the Florida counties of Sarasota and Manatee, falling 8.3% and 7.8% annually. Black Hawk, Iowa and Benton, Ark., tied with a 6.7% decrease, while Washington, D.C.’s 6.1% decline rounded out the top five.
Florida also led the counties above 1 million in population, with annual prices in Hillsborough and Orange counties decreasing 2.4% and 2.2%, respectively. Behind them came Pima, Ariz. (-2.1%), Harris, Texas (-2%), and Duval, Fla. (-1.7%).
The table below shows the top 20 counties by lowest annual home price growth:
| County | State | Home buying share of average wages | Renting share of average wages | Annual home price growth | Median sales price | Annual rental price growth | Average monthly rent |
| Sarasota | Florida | 44.8% | 51.5% | -8.3% | $ 440,000 | -3.1% | $ 2,824 |
| Manatee | Florida | 51.2% | 56.1% | -7.8% | $ 470,000 | -1.9% | $ 2,895 |
| Black Hawk | Iowa | 24.8% | 22.3% | -6.7% | $ 195,950 | 13.0% | $ 1,045 |
| Benton | Arkansas | 29.2% | 26.5% | -6.7% | $ 350,000 | -10.5% | $ 1,700 |
| District Of Columbia | District of Columbia | 42.3% | 35.4% | -6.1% | $ 785,500 | 0.9% | $ 3,544 |
| Pinellas | Florida | 40.8% | 50.1% | -6.0% | $ 412,500 | 2.7% | $ 2,803 |
| Volusia | Florida | 39.8% | 45.9% | -5.8% | $ 325,000 | -4.5% | $ 2,100 |
| San Joaquin | California | 55.4% | 48.5% | -5.5% | $ 520,000 | 1.3% | $ 2,532 |
| Lake | Florida | 45.5% | 47.6% | -5.4% | $ 359,500 | -3.7% | $ 2,098 |
| Pasco | Florida | 38.3% | 43.4% | -5.2% | $ 322,000 | -2.6% | $ 2,086 |
| Douglas | Colorado | 55.3% | 41.6% | -5.2% | $ 730,000 | -2.0% | $ 2,925 |
| Indian River | Florida | 41.8% | 55.6% | -5.0% | $ 384,821 | -30.1% | $ 2,739 |
| Clayton | Georgia | 19.7% | 26.4% | -5.0% | $ 216,000 | -3.2% | $ 1,674 |
| Coweta | Georgia | 43.3% | 43.2% | -4.9% | $ 370,000 | 0.9% | $ 1,992 |
| Henry | Georgia | 41.3% | 42.0% | -4.6% | $ 310,000 | -1.0% | $ 1,826 |
| Dekalb | Georgia | 29.9% | 29.6% | -4.6% | $ 340,000 | -1.9% | $ 1,906 |
| Mobile | Alabama | 15.1% | 29.0% | -4.5% | $ 150,000 | 7.2% | $ 1,496 |
| Polk | Florida | 35.7% | 40.3% | -3.8% | $ 300,000 | -2.4% | $ 1,899 |
| Harnett | North Carolina | 40.1% | 44.0% | -3.8% | $ 300,000 | -2.1% | $ 1,758 |
| Madison | Alabama | 23.4% | 25.0% | -3.3% | $ 295,000 | -3.8% | $ 1,636 |
Counties with the lowest home prices
Meanwhile, you’ll find the cheapest median sales prices in the counties of Peoria, Ill. ($134,000), Delaware, Ind. ($143,000), Mobile, Ala. ($150,000), Commanche, Okla. ($150,369), and Bibb, Ga. ($159,900).
Check your home buying options. Start hereAccounting for only those over a million, $165,000 in Wayne County, Mich. topped the chart. Then came $201,000 in Cuyahoga, Ohio; $221,500 in Allegheny, Pa.; $274,990 in Bexnar, Texas; and $295,000 in Duval, Fla.
The table below shows the top 20 counties by lowest median sales price:
| County | State | Home buying share of average wages | Renting share of average wages | Annual home price growth | Median sales price | Annual rental price growth | Average monthly rent |
| Peoria | Illinois | 14.5% | 22.4% | 3.1% | $ 134,000 | -5.3% | $ 1,320 |
| Delaware | Indiana | 18.0% | 29.0% | 5.9% | $ 143,000 | 5.0% | $ 1,260 |
| Mobile | Alabama | 15.1% | 29.0% | -4.5% | $ 150,000 | 7.2% | $ 1,496 |
| Comanche | Oklahoma | 18.9% | 29.3% | 7.4% | $ 150,369 | 25.4% | $ 1,285 |
| Bibb | Georgia | 18.8% | 26.7% | 7.9% | $ 159,900 | -1.1% | $ 1,236 |
| Richmond | Georgia | 18.4% | 29.6% | -1.2% | $ 163,000 | 4.4% | $ 1,462 |
| Mahoning | Ohio | 21.7% | 28.1% | 8.5% | $ 164,000 | 12.7% | $ 1,211 |
| Montgomery | Alabama | 16.7% | 24.0% | 13.6% | $ 164,687 | 3.6% | $ 1,243 |
| Caddo | Louisiana | 19.6% | 25.2% | 7.3% | $ 164,900 | -4.2% | $ 1,198 |
| Wayne | Michigan | 14.9% | 21.3% | 6.5% | $ 165,000 | 0.0% | $ 1,350 |
| Lucas | Ohio | 19.9% | 24.1% | 11.7% | $ 166,000 | 3.3% | $ 1,238 |
| Wichita | Texas | 23.1% | 33.5% | 4.5% | $ 173,003 | 4.2% | $ 1,476 |
| Jefferson | Texas | 17.4% | 23.7% | 4.1% | $ 174,250 | 1.1% | $ 1,387 |
| Madison | Indiana | 23.1% | 33.5% | 12.8% | $ 174,900 | 6.6% | $ 1,386 |
| Muscogee | Georgia | 21.8% | 28.8% | 9.3% | $ 175,000 | 2.9% | $ 1,286 |
| Saint Clair | Illinois | 23.9% | 28.1% | 5.6% | $ 179,500 | -11.5% | $ 1,328 |
| Jefferson | Alabama | 16.3% | 20.2% | 14.2% | $ 179,900 | -7.7% | $ 1,200 |
| Winnebago | Illinois | 23.0% | 32.2% | 8.8% | $ 185,000 | 10.4% | $ 1,618 |
| Genesee | Michigan | 22.8% | 25.5% | 10.8% | $ 185,000 | 15.9% | $ 1,188 |
| Sangamon | Illinois | 20.4% | 23.2% | 9.3% | $ 186,310 | 0.2% | $ 1,353 |
The bottom line
Home buyers and renters alike struggle with affordability challenges.
However, 2026 is shaping up to be a better year for borrowers as it’s cheaper to buy than rent in the majority of the country. If you’re in the market to buy, it’s advantageous to be prepared, learn how to negotiate your mortgage rate, and see if you qualify for down payment and/or closing cost assistance.
When you’re ready to begin your path to homeownership, reach out to a local mortgage professional and get started.
Time to make a move? Let us find the right mortgage for you