Key Takeaways
- The range of interest rates narrowed and trended downward in 2025.
- Home price growth slowed and even regressed in certain places.
- The supply of for-sale homes continued to rebound, surpassing 1 million units.
Those who don’t learn from the past are doomed to repeat it.
And so, The Mortgage Reports looked back at what 2025 data revealed and see what the housing market possibly taught us.
When buying, selling, or refinancing a home, knowing the current trends and what’s projected to come can help you get a better deal.
2025 at a glance...
- Mortgage rates
- Video: 2025 housing market recap
- Mortgage applications
- Home price movement
- Home sales
- Housing inventory
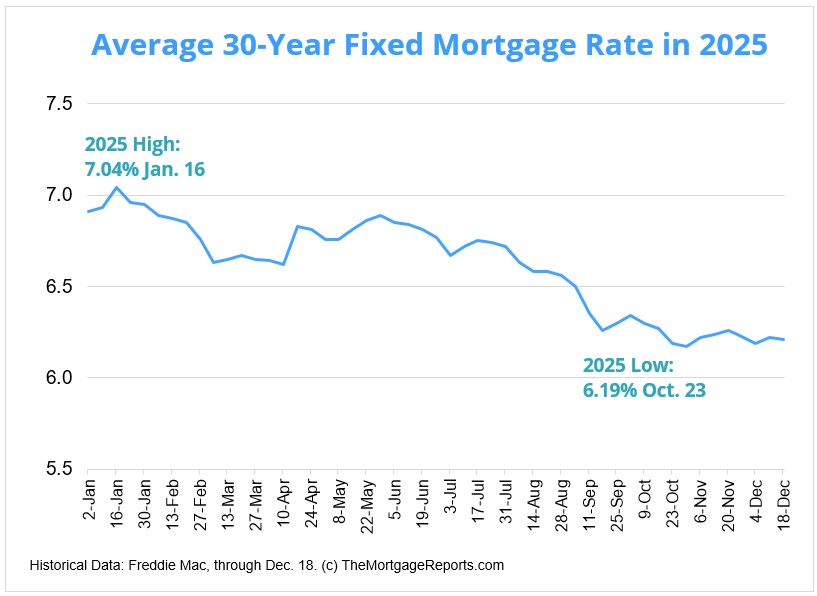
Where mortgage rates went in 2025
After the rock-bottom, fever dream interest rates of 2021, subsequent volatility and rapid inflation caused rates to climb to 23-year highs in 2023. Rates gradually descended overall in 2024, then again in 2025 with added stability.
In its general downtrend throughout 2025, the average 30-year fixed rate moved between 6.17% and 7.04% (a range of 87 basis points). The range tightened and the ceiling lowered from both 2024 (114 points and 7.22%), and 2023 (170 points and 7.79%), according to Freddie Mac.
Rates in the fourth quarter were especially steady, oscillating between just 6.17% and 6.34% from Oct. 2 to Dec. 18.
Consensus among industry experts forecast a gradual and modest decline over the course of 2026. Still, interest rates sit below the historical average of about 7.8% dating back to April 1971.
Borrowers with better credit scores tend to qualify for mortgage rates below the market average. Regardless of your credit or where rates go, shopping and negotiating with multiple lenders has shown to potentially save thousands of dollars over the life of your loan.
Video: 2025 housing market explained
Mortgage applications and credit availability up
With comparatively lower rates and Borrower activity grew in 2025 from
The Mortgage Bankers Association’s (MBA) weekly mortgage application report from Dec. 12 showed a 86% year-over-year surge in the refinance index and 13% growth in the purchase index.
“Mortgage volume in 2025 increased compared to 2024, thanks to declining mortgage rates, and MBA expects continued improvement in 2026,” said Bob Broeksmit, president and CEO at the MBA.
In addition to mortgage rates, lender underwriting standards — their willingness to approve a home loan — can impact application volume.
Underwriting a mortgage depends on both the borrower’s financial profile and overall economic conditions at the point of application. Because of this, mortgage lenders constantly adjust their underwriting requirements. Their willingness to approve and take on a home loan
In a hot economy, lenders tend to become more lenient since those home loans come with less risk. The opposite holds true during leaner times or recessions due to heightened uncertainty.
The MBA measures this phenomenon with a baseline score of 100 in its Mortgage Credit Availability Index (MCAI). Any score above 100 means lenders are more likely to extend credit while anything below indicates tighter standards.
The MCAI increased over its last five months, growing to 107.5 in November from 106.8 in October and 95.9 in November 2024. The table below shows the MCAI readings for 2024 and 2025, according to the MBA:
| Month | MCAI | Month | MCAI |
| January 2024 | 92.7 | January 2025 | 99.0 |
| February 2024 | 92.9 | February 2025 | 100.4 |
| March 2024 | 93.9 | March 2025 | 102.9 |
| April 2024 | 94.0 | April 2025 | 102.9 |
| May 2024 | 94.1 | May 2025 | 105.1 |
| June 2024 | 95.0 | June 2025 | 103.7 |
| July 2024 | 98.1 | July 2025 | 103.9 |
| August 2024 | 99.0 | August 2025 | 104.0 |
| September 2024 | 98.5 | September 2025 | 104.4 |
| October 2024 | 99.2 | October 2025 | 106.8 |
| November 2024 | 95.9 | November 2025 | 107.5 |
| December 2024 | 96.6 |
Home prices slow
As property values generally follow an upward trajectory, owning real estate tends to be a safer investment in the long-term.
This year, the pace of of home value growth decelerated (and even regressed in some places), normalizing from the historical highs seen in 2020 and 2021.
U.S. home prices rose 1.1% year-over-year in October while dipping 0.2% month-over-month, according to the latest Home Price Index from Cotality.
“The housing market in 2025 demonstrated remarkable resilience despite significant headwinds. Slowing price growth reflects a much-needed rebalancing after years of unsustainable gains. While some markets are experiencing declines, these adjustments will help restore affordability over time and make housing more accessible to a wider group of buyers,” said Selma Hepp, chief economist at Cotality.
Annual appreciation ranged by nearly 10 percentage points across the country. Wyoming led all states with a 7.27% gain. Connecticut (6.17%), New Jersey (5.28%), Illinois (4.73%), and Nebraska (4.67%) rounded out the top five. Eight states/districts decreased yearly, with Florida falling furthest (-2.5%). Above that came Texas (-1.71%), Arizona (-0.89%), Colorado (-0.85%), and Hawaii (-0.82%).
“Looking ahead, regional differences will remain pronounced, with demand favoring areas that offer both economic opportunity and relative affordability,” Hepp continued. “In general, home price growth is projected to remain below the long-running average of 4% to 5%. However, mortgage rates will play a critical role in shaping the 2026 housing market. A notable drop in mortgage rates combined with low supply could lead to a re-acceleration of price gains.”
Home sales grow modestly
The pace of homes sold is indicative of the sector’s performance. It can also tell a story of how demand compares to supply and affordability.
A seasonally adjusted annual rate of 4.13 million existing homes sold in November, according to the National Association of Realtors (NAR). This increased 1% year-over-year and 0.5% month-over-month. First-time home buyers comprised 30% of sales, flat from the year before and down from 32% in October.
Check your home loan optionsBroken down by price level, the $250,000-$500,000 tier accounted for 44.6% of existing home sales. Among the country’s four major regions, the South led with a 46% share of sales, followed by 24% in the Midwest, 18% in the West and 12% in the Northeast.
“Existing-home sales increased for the third straight month due to lower mortgage rates this autumn,” said Lawrence Yun, chief economist at NAR. “However, inventory growth is beginning to stall. With distressed property sales at historic lows and housing wealth at an all-time high, homeowners are in no rush to list their properties during the winter months.”
NAR projects a 14% nationwide increase in home sales in 2026, driven by job growth, increased inventory, and a modest decline in its mortgage rate forecast.
For-sale housing inventory rebounds
While the supply of for-sale homes still lags pre-pandemic totals, a recovery carried throughout 2025. The count of active property listings jumped 12.6% annually in November, according to the most recent data from Realtor.com.
A typical day during the month yielded 1.07 million for-sale listings, down from 1.1 million in October but above 953,452 in November 2024. It marked the 25th straight month of annual growth.
Verify your home buying eligibility“A number of sellers are retreating after listing if the market doesn’t meet their price expectations, while buyers are strategically redirecting to the metros that remain affordable,” said Danielle Hale, chief economist at Realtor.com. “These dynamics reflect how higher rates and years of rapid price growth have rewritten the rules of engagement for both buyers and sellers. As we move into 2026, gradual improvements in affordability and more consistent inventory will be key to unlocking a more balanced market.”
Additionally, the median time listings spent on the market ticked up to 64 days from 63 days in October and 62 days the year prior. The share of listings with price reductions hit 18%, down monthly from 20.2% but up annually from 16.7%.
The median listing price went to $415,000 in November, down 2.2% from $424,200 in October and 0.5% from $416,880 in November 2024. It also marks a 34.3% growth rate from $309,000 in November 2019.
Among the 50 largest U.S. housing markets, Charlotte, N.C., led the way with a 34.7% year-over-year increase in active listing count. Just behind that were gains of 33% in Las Vegas, 32% in Washington, D.C., 30.2% in Raleigh, N.C., and 28.4% in Seattle.
The table below shows the top 10 metro areas by largest annual rises in listing count in November:
| Metro | Active Listing Count YoY | Median List Price | Median List Price, YoY | Median Days on Market, YoY (Days) | Price Reduced Share | Price-Reduced Share, YoY (% Points) |
| Charlotte, N.C. | 34.7% | $429,740 | 0.2% | 7 | 22.7% | 3.6 |
| Las Vegas | 33.0% | $469,997 | 0.0% | 9 | 21.3% | 3.9 |
| Washington, D.C. | 32.0% | $575,000 | -2.4% | 5 | 17.4% | 3.8 |
| Raleigh, N.C. | 30.2% | $445,000 | -1.1% | 8 | 22.0% | 4.5 |
| Seattle | 28.4% | $749,950 | 1.3% | 5 | 18.8% | 4.5 |
| Indianapolis | 24.2% | $315,000 | -0.3% | 2 | 28.7% | 2 |
| Louisville, Ky. | 23.6% | $309,900 | 0.0% | -1 | 21.2% | 0.2 |
| Baltimore | 22.8% | $375,000 | 4.2% | 4 | 19.3% | 2.5 |
| Boston | 21.8% | $785,000 | -4.3% | 2 | 18.7% | 3.6 |
| Detroit | 21.7% | $255,000 | -1.9% | 0 | 19.5% | 4.2 |
At the other end, Chicago gained the least for-sale inventory, decreasing 1.5% from November 2024. San Francisco and Jacksonville, Fla., also declined, falling 0.9% and 0.8% annually. Above those, Milwaukee grew 0.6%, and Grand Rapids, Mich., by 3.2%.
The table below shows the bottom 10:
| Metro | Active Listing Count YoY | Median List Price | Median List Price, YoY | Median Days on Market, YoY (Days) | Price Reduced Share | Price-Reduced Share, YoY (% Points) |
| Chicago | -1.5% | $355,900 | -1.1% | 0 | 16.0% | 1.4 |
| San Francisco | -0.9% | $915,000 | -5.6% | -1 | 14.1% | 1 |
| Jacksonville, Fla. | -0.8% | $389,000 | -1.3% | 6 | 23.8% | 0.5 |
| Milwaukee | 0.6% | $379,000 | 3.8% | 1 | 17.1% | -0.4 |
| Grand Rapids, Mich. | 3.2% | $389,900 | 4.0% | -2 | 19.7% | 0.3 |
| New York | 4.0% | $750,000 | -2.3% | 1 | 8.6% | 0.5 |
| Pittsburgh | 5.4% | $245,000 | 4.3% | 0 | 19.2% | 1.2 |
| Minneapolis | 6.0% | $410,000 | -2.4% | -1 | 16.8% | 0.4 |
| Philadelphia | 6.3% | $370,000 | -0.7% | 0 | 16.8% | 1.7 |
| Cleveland | 6.6% | $250,000 | 0.0% | 1 | 17.6% | 0.2 |
The bottom line
Navigating the housing market can be difficult, but knowing the data trends (and what they mean) is half the battle.
If you’re looking to buy, sell, or refinance your home, get prepared, find helpful expert advice, and see if you qualify for financial assistance.
Ready to begin? Reach out to a local mortgage professional today.
Time to make a move? Let us find the right mortgage for you