Big gains in for-sale homes
After toiling through an extreme seller’s market over the past few years, prospective home buyers are finally getting some relief as housing inventory rebounds from historic lows.
Homes for sale grew at a record pace for the sixth consecutive month in February, surging 67.8% annually, according to Realtor.com.
While the elevated mortgage rates of 2023 lessened affordability, they’ve also tempered buyer competition and ultimately led to more houses on the market. If you’ve been unsuccessful in your home search, 2023 could be your year.
Verify your home buying eligibility. Start hereFebruary’s housing market
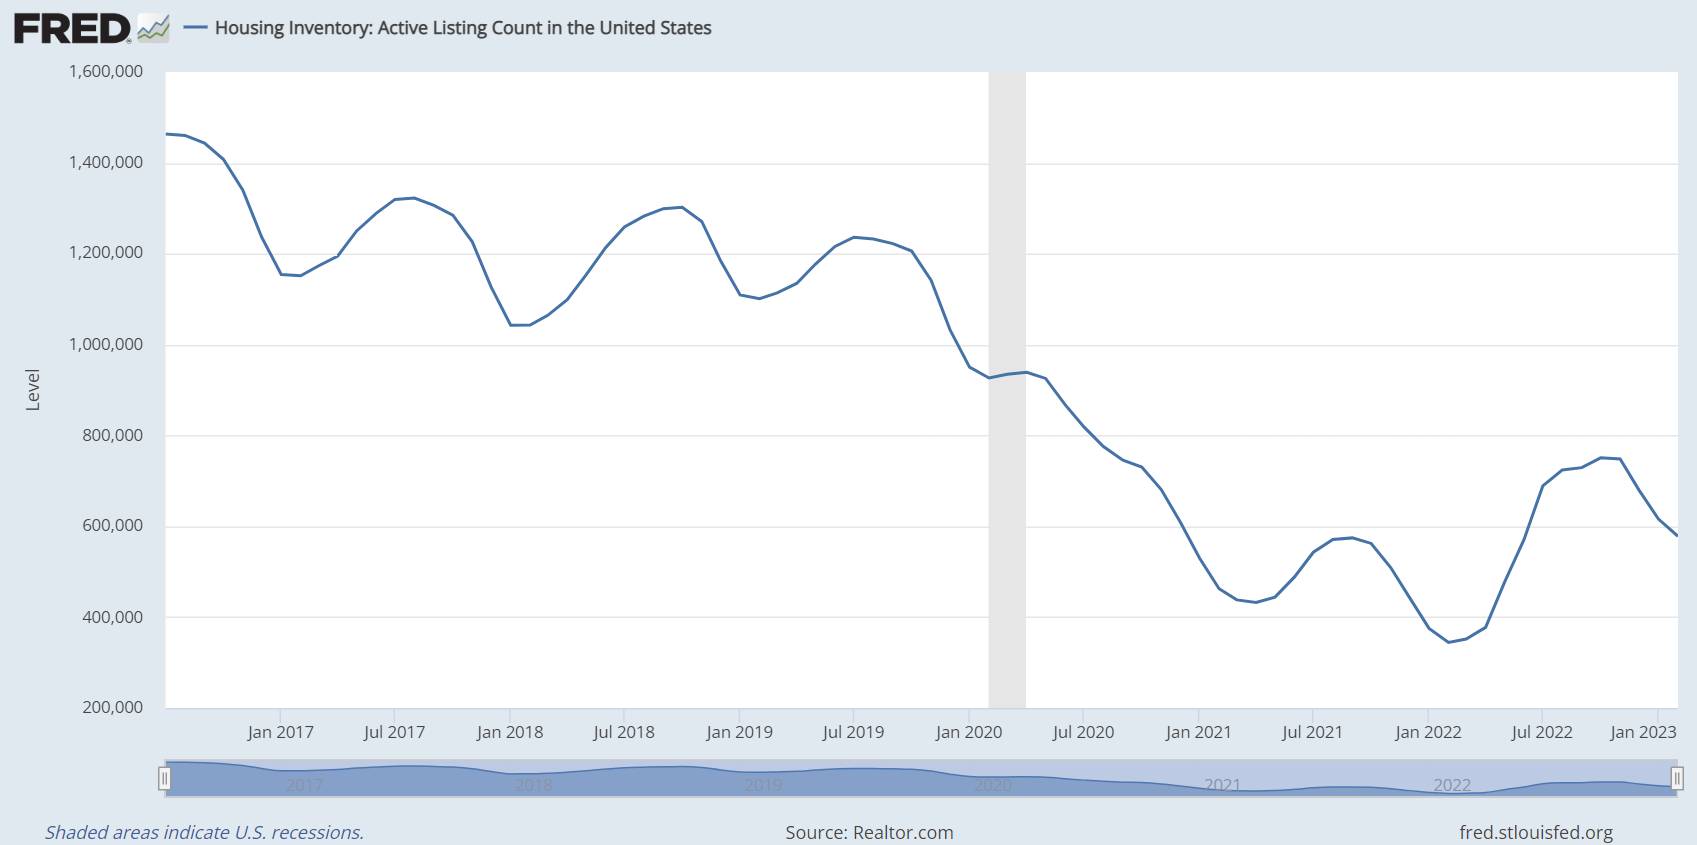
The lack of inventory has been the housing market’s underlying issue for years. Although supply has a big deficit to overcome, the recovery from the pandemic’s buying frenzy is underway.
The amount of active property listings climbed at a record rate for the sixth straight month in February. Homes for sale spiked 67.8% compared to February 2022. However, the total still stands 47.4% below the February average from 2017 to 2019.
“High home prices and mortgage rates continue to cut into buyer interest and homes are taking more than three weeks longer to sell than last year,” said Danielle Hale, chief economist at Realtor.com. “With a smaller pool of buyers today and more competition from other homes on the market, home sellers will likely need to adjust their price expectations in the market this spring.”
While home values continue growing, the pace greatly dialed down from the breakneck speeds of 2021 and 2022. February’s annual appreciation rate of 7.8% marked the third consecutive month in the single digits and brought the U.S. median listing price to $415,000, up from $392,000 the year prior. For comparison, February 2021 and 2022 respectively had annualized growth rates of 13.7% and 12.9%.
The typical for-sale home spent 67 days as an active listing in February. The median days on market increased from 44 days year-over-year, but still trails the 87 day average from February 2017 to 2019.
Because properties are sitting on the market longer, more sellers reduced their prices. A 13.3% share of active listings had price reductions in February. This compared to 5.7% in Feb. 2022 and an average of 16% in the three pre pandemic February’s. It all adds up to borrowers having increased leverage when home buying.
“Potential buyers looking to take advantage of more homes to choose from and a less competitive pace also have more negotiating power than they did a year ago. So if a home has been on the market a while without receiving any offers, they may want the seller to contribute to their closing costs, make expensive repairs, or even buy down their mortgage rate,” said Clare Trapasso, executive news editor at Realtor.com.
Where housing inventory climbed most
Among the 50 largest metropolitan areas, the highest annual gains in active listings came across the southwest and southeast. Six markets saw increases above 200% and 16 total surpassed 100%.
Austin, Texas led them all with a 335.1% spike in for-sale houses year-over-year in February. Raleigh, N.C., was second at 329.8%, followed by Nashville, Tenn., at 299.7%.
Meanwhile, only Hartford, Conn., saw a decline, with active listings falling annually by 8.8%. New York, Chicago and Milwaukee had the smallest gains at 5.9%, 10.8% and 18.1%, respectively.
Below are the top-20 markets by gains in homes for sale in February 2023 from February 2022.
| Rank | Metro Area | Active Listing Count YoY | Median Listing Price | Median Listing Price YoY | Price Reduced Share | Median Days on Market |
| 1 | Austin, Texas | 335.1% | $533,000 | -8.0% | 25.4% | 72 |
| 2 | Raleigh, N.C. | 329.8% | $449,000 | 3.6% | 13.2% | 68 |
| 3 | Nashville, Tenn. | 299.7% | $518,000 | 8.9% | 19.0% | 39 |
| 4 | Tampa, Fla. | 224.5% | $400,000 | 1.4% | 21.1% | 60 |
| 5 | Phoenix, Ariz. | 208.6% | $487,000 | -2.6% | 24.6% | 62 |
| 6 | Dallas, Texas | 208.2% | $435,000 | 5.6% | 15.9% | 61 |
| 7 | Jacksonville, Fla. | 172.5% | $390,000 | 2.2% | 19.1% | 65 |
| 8 | Orlando, Fla. | 153.1% | $435,000 | 9.4% | 16.1% | 65 |
| 9 | San Antonio, Texas | 150.4% | $340,000 | 1.0% | 17.2% | 70 |
| 10 | Charlotte, N.C. | 136.6% | $397,000 | 1.9% | 13.7% | 57 |
| 11 | Memphis, Tenn. | 136.1% | $323,000 | 42.7% | 15.0% | 69 |
| 12 | Oklahoma City, Okla. | 120.8% | $349,000 | 6.1% | 14.9% | 53 |
| 13 | Denver, Colo. | 116.8% | $630,000 | -2.8% | 13.1% | 44 |
| 14 | New Orleans, La. | 115.1% | $325,000 | -7.0% | 15.4% | 71 |
| 15 | Las Vegas, Nev. | 105.9% | $446,000 | -6.2% | 21.9% | 67 |
| 16 | Seattle, Wash. | 102.4% | $750,000 | 3.8% | 10.1% | 45 |
| 17 | Riverside, Calif. | 94.7% | $560,000 | 1.8% | 13.9% | 66 |
| 18 | Miami, Fla. | 87.7% | $599,000 | 14.7% | 14.6% | 69 |
| 19 | Indianapolis, Ind. | 86.2% | $300,000 | 2.8% | 14.4% | 61 |
| 20 | Kansas City, Mo. | 82.5% | $442,000 | 14.2% | 8.8% | 92 |
Opportunity for borrowers
If a dearth of listings and fierce competition kept you from buying property over the last few years, opportunity could be knocking in 2023.
The amount of homes for sale has been rising and that’s good news for house hunters.
If you’re ready to become a homeowner, reach out to a local lender to see what rate you qualify for, your optimal loan type and how much home you can afford.
Time to make a move? Let us find the right mortgage for you