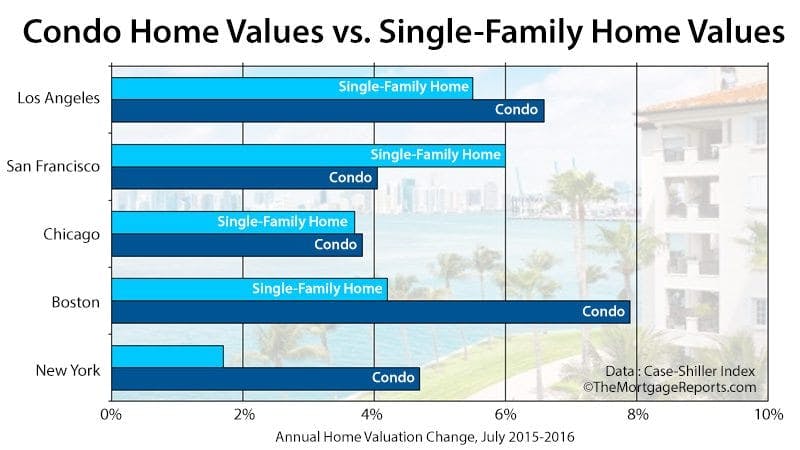
If you want to be notified when I write something new on The Mortgage Reports, sign up for free daily email alerts or subscribe to the free RSS feed.

Case-Shiller Index Shows 5% Growth In June But The Data Is “Imperfect”

Posted on September 1, 2010
Filed under Real Estate Sales

Case-Shiller June 2010

Home prices are rising, says the news. But are they really?  The cited data may be too old to be relevant.

Case-Shiller Index Says Monthly Home Values Up 5% in June

According to the Standard & Poors Case-Shiller Index, home values rose 5 percent in June versus the month prior, and 4 percent from a year earlier.

It’s the 16th consecutive month in which Case-Shiller reported an increase in home values and the third straight month of outstanding results.  On paper, the figures look great, but homeowners and home buyers in Cincinnati area would do well to temper their Case-Shiller enthusiasm.

For a few reasons, really.

The Obvious Flaws In The Case-Shiller System

The Case-Shiller Index is accurate, and imperfect. There's several reasons why we have to look deeper than the headlines.

First, Case-Shiller releases data on 60-day delay and, over the last 60 days, housing data has been lackluster at best.

Knowing what the housing market did on June 30 has as little relevance as knowing what the weather report was from that day.  You can't apply the data from 2 months ago to make an informed decision today.

June is ancient real estate history to buyers and sellers in Cincinnati.

And, second, the Case-Shiller Index is not "local".  It's a composite of 20 cities, none of which are in Southeastern Ohio. Neither Cincinnati, Dayton, nor Columbus make the list, rendering the data somewhat useless to local folks anyway.

Click here for better, truly local real-time real estate data in Cincinnati.

Case-Shiller Is Good For Economists, Bad For Consumers

The Case-Shiller Index isn't all bad. After all, it's "good" data.  It's just delayed and general.  That's fine if you're an economist or policy-maker in need of clues on housing, but it ain't no good if you're trying to make a buy or sell decision.

For that, you need your real estate stats to be more better.

And then, when you've found a home and it's time for your mortgage, give me a call or .

(Post adapted from Bring the Blog, a blogging service for real estate and mortgage pros)


Dan Green is an active loan officer. Email or call 513-443-2020. Dan is on Twitter at @mortgagereports.

Tags: Case-Shiller Index, Home Values, Real-Time Real Estate Data

MailChimp

With Home Values Rising, We Can See Where The Bottom Was

Posted on July 14, 2010
Filed under On Buying Real Estate

Monthly change in Home Price Index from April 2007 peak

Last week, the Case-Shiller Index reported home values up 0.8 percent across 20 tracked markets. Then, the public-sector Federal Housing Finance Agency reached a similar conclusion.

They're both good news for housing, of course. But can we believe it?

Good Signs For Housing -- Values Are Rising

Reporting on a two-month lag, the government's Home Price Index shows home values up 0.8 percent in April, buoyed by the expiring federal home buyer tax credit and low mortgage rates.  It's a positive signal for a recovering housing market in Cincinnati and everywhere else.

But just because the Home Price Index says home values are rising, that doesn't mean they are. The Home Price Index methodology is flawed on multiple fronts.

The Flaws Of The Home Price Index Revealed

The biggest flaw is that the Home Price Index reports on a 60-day delay. A two-month lag like this turns the HPI into a trailing indicator for the housing market instead of a forward-looking one. If you're a home buyer looking for direction, HPI won't give it to you -- look to your real estate agent instead.

Second, HPI only accounts for home values in which the home's attached mortgage is backed by Fannie Mae or Freddie Mac.  Therefore, as the FHA market share grows, fewer homes are getting included in the HPI sample set, and HPI values may skew high or low.

And, lastly, the Home Price Index doesn't account for new home sales -- only repeat ones.  This, too, eliminates a major segment of the market.

The Home Price Index Is The Best Of What's Around

All of that said, though, the Home Price Index remains important to housing.  It's the most comprehensive, thorough home valuation model in print and that fact can't be ignored.  That, and the HPI has been giving strong readings since the start of year.

So here we are.  It's July. By now, the market's bottom has passed and sellers are regaining their negotiating power. However, homes remain relatively inexpensive and mortgage rates are absurdly low.

It's an excellent time to get off the fence and make that offer.

Get a free, no-obligation quote on a mortgage. or call me at 513-443-2020.  I answer my calls and answer all my own emails.


Dan Green is an active loan officer. Email or call 513-443-2020. Dan is on Twitter at @mortgagereports.

Tags: Case-Shiller Index, Home Affordability, Home Price Index, mortgage rates

Trade In Your Case-Shiller Index For Real-Time Real Estate Data Instead

Posted on April 30, 2010
Filed under Real Estate Sales

Case-Shiller Change In Home Values Jan-Feb 2010

Standard & Poors released its February Case-Shiller Index this week.  The index is a home price tracker for select U.S. metro areas.

According to Case-Shiller, home values fell nationwide.

The Headlines Were Twisted To Look "Sunny"

Most of the 20 markets tracked by Case-Shiller fell in February. Only San Diego showed an increase. The other 19 Case-Shiller markets averaged a 1.23 percent decline between January and February.

However, that's not the story you might have read in the papers.

Instead, you may have seen that home values were up nationwide, citing annualized home price data. Unfortunately, data like that is mostly useless to buyers and sellers.  It's the month-to-month figures that matter.

Are home prices rising right now?  Are home prices falling right now?  These are the questions that set the tone of negotiation.  As in, "I don't care what your home was worth last year. This is what I'm offering today."

The rosier, annualized data that was highlighted in the press doesn't capture the reality of what was February 2010.

And that brings us another issue.  Even the Case-Shiller isn't the "right now".

The Flaws Of The Case-Shiller Index Exposed

For all of its popularity as a private-sector gauge of housing, the Case-Shiller Index is a broad view of housing, better suited for economists and politicians.  It does very little for the everyday homeowners.

First, the data reports on a 2-month lag.  The data we parse in May is collated from February's closing.  That's 2-plus months ago and, in real estate terms, 2-plus months is a lifetime.

Second, the Case-Shiller Index is limited to just 20 cities which, in total, represent just 9% of the U.S. population.  It's not even the 20 biggest cities, either.  Houston, Philadelphia, San Antonio and San Jose are excluded and each ranks among the country’s 10 most populous areas.

And, lastly, Case-Shiller ignores the First Rule of Real Estate -- all real estate is local. Even as the index highlights Chicago, it says nothing for how the Lincoln Park or Wrigleyville neighborhoods compare to Hinsdale.

The best real estate data is real-time real estate data.

Beat The Case-Shiller Index With Real-Time Data

Better real estate decisions start with better data.  If you live in Cincinnati, you should be getting these free weekly market reports -- no question.

If you live outside of Cincinnati and want to follow free, real-time real estate data for your market, just with your city, state and ZIP code.  If your market is covered, I'll hook you up.


Dan Green is an active loan officer. Email or call 513-443-2020. Dan is on Twitter at @mortgagereports.

Tags: Case-Shiller Index, Home Values, Real-Time Real Estate Data

Home Prices Still Rising, Says The October Home Price Index Report

Posted on December 30, 2009
Filed under Real Estate Sales

Home Price Index April 2007 to October 2009

Author's Note: This post was written for Bring the Blog, a mortgage and real estate professionals' service that writes supplemental blog content. I am the owner of the company.  The local keywords "Cincinnati", "Blue Ash", and "Hyde Park" were added automatically via Bring the Blog's localization system.

More positive signals from housing -- home values are still on the rise.

According to the Federal Housing Finance Agency, after posting its first quarterly increase since 2007 this past September, the Home Price Index rose by another 0.6 percent in October.

Prices are up in 4 of the last six months.

But before we take the stats to the proverbial bank, it's important that we recognize the Home Price Index for its shortcomings.

  1. HPI only accounts for homes with mortgages backed by Fannie Mae or Freddie Mac
  2. HPI only accounts for re-sold homes -- newly-built homes are excluded
  3. HPI aggregates national data whereas real estate markets are local phenomena

On a broad scale, the Home Price Index can be useful, but it doesn't specifically apply to Cincinnati or any specific U.S. market.  For that, analysts tend to turn to the Case-Shiller Index, a privately-produced report that assesses home values in 20 cities nationwide.

The good news for home sellers in Blue Ash and Hyde Park is that Case-Shiller's most recent report corroborates the government's conclusion -- home values are creeping back.

Home buyers should pay attention. When public and private sector data is in accord, markets tend to go along and, looking back, housing likely bottomed in February 2009.

Since then, home sales are up, home supplies are down, and values have increased in most U.S. markets. Furthermore, so long as mortgage rates remain low and government stimulus is in place, the trend should continue through at least the first quarter of 2010.

If you're on the fence about buying a home right now, or wondering about timing, consider your options vis-a-vis today's market.  Into the new year, homes won't likely be as cheap to buy, nor to finance.


Dan Green is an active loan officer. Email or call 513-443-2020. Dan is on Twitter at @mortgagereports.

Tags: Case-Shiller Index, Home Price Index

The 2009 Summer Homebuying Season Was Good To A Lot Of States, Ohio And Illinois Included

Posted on November 30, 2009
Filed under Real Estate Sales

Home Price Index Q3 2009 By State

The housing market is in recovery. There's lot of stats to back it up so take your pick:

And, perhaps, most importantly, the best gauge of the housing market's health -- home values -- is showing consistent improvement.  Both private-sector Case-Shiller Index and the government's own Home Price Index showed home prices on the mend.

Foreclosures may not yet have peaked, but the worst of the housing market is definitely behind us. Anyone who tells you otherwise is selling something.

Between the 2nd and 3rd quarter this year, according to the Federal Home Finance Agency, home values rose 0.2 percent nationally.

Now, it's a statistic without direct meaning to homeowners because the "national real estate market" doesn't exist.  You don't buy a home in America -- you buy a home in Cincinnati.  The Home Price Index data remains important for trending reasons, however.  Especially to lenders.

See, unlike you and me -- people with a limited geographical exposure to the housing markets -- lenders are nationwide.  To them, national data is extremely relevant.

A "national" real estate portfolio is a lender's path to diversification.

So, as we dissect Q3's data, it's important to pick up on a few of the subtler points as compared to Q2.

First, geography does not appear correlated to home price improvement. Each region is represented equally in the Top 10 and spread equally throughout the list.  Clearly, this isn't just a Coastal Recovery.

And second -- stunning analysts -- is that home value changes are occurring independent from foreclosure activity.  For example:

  1. California ranks #2 in home value improvement between Q2 and Q3 2009.  Over that same period, California's Foreclosures per Capita is second-worst in the nation, behind Nevada.
  2. Illinois beat the national average for home value improvement between Q2 and Q3 2009.  Over that same period, though, Illinois foreclosure rate was nearly 3 times the national average.
  3. Between Q2 and Q3 2009, Delaware's foreclosure activity was third-lowest in the country. Its home values, however, fell by more than any other state.

The supply-driven relationship between foreclosure rate and home prices is broken. This is because buy-side demand for homes now exceeds new supply is most U.S. markets.  The inevitable result is higher prices everywhere.

Low mortgage rates, an expanded tax credit, and general optimism about housing should sustain demand through the winter.  Therefore, expect home values to continue to climb further.  If you plan to buy a home in 2010, consider moving up your time frame.

The best "deals" may the ones you get between now and the Super Bowl.

To get a feel for what mortgage rates and payments look like in your local market, with the details of your purchase. I may have some follow-ups for you, but it's a good place to start.  I respond to all of my own emails and I'm pretty quick about it, too. I can send a Good Faith Estimate upon request.


Dan Green is an active loan officer. Email or call 513-443-2020. Dan is on Twitter at @mortgagereports.

Tags: Case-Shiller Index, Home Price Index, The Princess Bride

Looking For The Housing Bottom? These Stats Say It Was Back In February 2009.

Posted on October 28, 2009
Filed under Real Estate Sales

Case-Shiller market data August 2009

For the 7th consecutive month, the Case-Shiller Index showed a reduction in annual home price declines.  That's more than two seasons, folks. Surely, by now, we can say housing is in recovery.

And, even more impressive than the annual Case-Shiller figures are the monthly ones. 

According to the data, 17 of the 20 Case-Shiller markets improved between July and August 2009.  It's one fewer than last month's 18-of-20, but impressive nonetheless.

Market-by-market, the funk is ending. Home values are rising.

Lest we get carried away, let's remember that the Case-Shiller methodology is flawed:

  1. It measures home values in just 20 U.S. cities.  Those 20 cities account for a paltry 9% of the U.S. population.
  2. Its data is on a 60-day delay.  Case-Shiller doesn't reflect the "right now" of housing. It reflects the "just was".
  3. It ignores the "all real estate is local" adage.  Case-Shiller lumps large metropolitan areas into one data reading.

Despite its flaws, however, the Case-Shiller Index remains relevant to housing.

See, as the economy progressively worsened throughout 2007 and 2008, Wall Street put the blame on housing, citing the Case-Shiller Index in support of the argument.  Analysts seemed to revel in the 33 percent drop in home values nationwide.

But now, as the Case-Shiller Index shows improvement, it's making a case that the economy is coming back from the brink.

An improving economy will harm home affordability.

Soon, government stimulus will fade, mortgage rates will rise, and sellers will regain the upper-hand in negotiations. Based on the Case-Shiller home value data, the "right time" to buy a home may have been in 7 months ago -- while the status of the recovery was still in doubt.

For a pre-approval letter for your next home, just and I'll get you started. You may have missed the market bottom, but this is definitely not the market top.  You may want to buy before the Case-Shiller runs its streak to a dozen.


Dan Green is an active loan officer. Email or call 513-443-2020. Dan is on Twitter at @mortgagereports.

Tags: Airplane!, Case-Shiller Index, MasterCard Commercials

It’s Time To Call The Housing Bottom : 95% Of Case-Shiller Markets Show Home Price Improvement

Posted on August 25, 2009
Filed under Real Estate Sales

Case-Shiller Index -- Comparing June 2009 levels to May 2009 levels

Maybe now we can say that housing has bottomed?

After 3 years of disastrous data, 19 of the 20 markets tracked by Case-Shiller improved last month -- the 5th straight month of strong data and the index's strongest showing in 3-plus years.

This is definitely something for the news van.

That said, the Case-Shiller Index remains an imperfect gauge:

  1. It's limited to 20 U.S. cities, representing just 9% of the U.S. population.
  2. It's on a 2-month lag, reflective of how housing was, not how it is
  3. It ignore locality, grouping city neighborhoods into one big lump.

Despite its flaws, though, the Case-Shiller Index remains relevant to an improving economy.

When housing cracks first started formed in 2005 and 2006, Wall Street doubled down its bets despite Case-Shiller calling for an all-out catastrophe of biblical proportions.  Turns out, both sides were wrong, but Case-Shiller earned a ton of street cred from its call.

Today, the Case-Shiller Index is the de facto barometer for home values nationwide.

Getting back to June data, because Case-Shiller says home prices are -- in its own words -- "on an upswing", we can assume it means good things for the housing market, in general.

For home buyers, however, the news may not be so welcome.  The combination of a soon-to-expire $8,000 First-Time Home Buyer Tax Credit and a rebounding housing market means that competition for properties should increase, creating bidding wars and higher home prices.

If you're on the fence about buying a home or wondering if the time is right, according to Case-Shiller, the "right time" may have been 2 months ago.  With prices on the upswing, homes may only get more expensive.

For a pre-approval letter, and I'll get you started.


Dan Green is an active loan officer. Email or call 513-443-2020. Dan is on Twitter at @mortgagereports.

Tags: Case-Shiller Index, Ghostbusters, Swingers, WPVI 6

Live Rate Quotes

Required fields are marked with*