Standard & Poor’s Case-Shiller Index reports that home values rose on both a monthly and annual basis in September. In some cities, home values climbed by a lot.
The September 2013 Case-Shiller Index highlights what many of today’s home buyers have already learned the hard way — that the housing market is expanding and that home values are rising.
Even for buyers using low-downpayment mortgages, homes are more costly as compared to one year ago.
Click to check today's mortgage rates
.
Case-Shiller Index : Las Vegas, San Francisco Lead Recovery
Standard & Poor’s recently released its September 2013 Case-Shiller Index. The index tracks home price changes from month-to-month, and year-to-year, in select cities nationwide. Tracked cities include San Diego, California; Los Angeles, California; and Phoenix, Arizona.
On a monthly basis, home values rose in all 20 tracked markets from May, led by a 1.5% gain in Detroit, Michigan. Phoenix showed strong growth, too, rising 1.2 percent from the month prior.
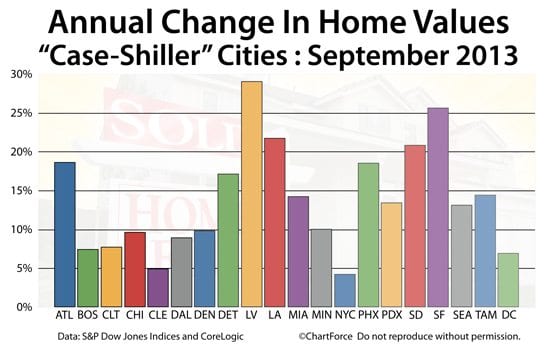
On an annual basis, the Case-Shiller Index showed broad-based gains.
All 20 tracked markets improved during the twelve months ending September 2013. Las Vegas and San Francisco led all cities with annual gains of 29.1% and 25.7%, respectively. Los Angeles ranked third at 21.8%.
The “weakest” of the Case-Shiller Index cities was New York City.
The New York City region — comprised of Manhattan, Brooklyn, Queens, Staten Island, and Yonkers — gained just 4.3% in value on an annual basis. This is more than three times less than the national average.
Despite the data, however, show restraint when applying Case-Shiller Index data for personal use. The figures should not be used to make a final “buy or rent” decisions. The Case-Shiller Index is flawed and may push you to improper conclusions.
The index’s first flaw is its most obvious — its limited sample set.
Click to compare mortgage rates and lenders
.
Flaw 1 : Not Enough Cities Included
According to Wikipedia, there are more than 3,100 municipalities nationwide. The Case-Shiller Index tracks just 20 of them. This is less than one percent of all U.S. cities and the cities tracked aren’t even the nation’s 20 largest cities.
Four of the 10 most populous U.S. Cities — Houston, Texas; Philadelphia, Pennsylvania; San Antonio, Texas; and San Jose, California — are absent from the Case-Shiller Index 20-City Composite whereas smaller cities such as Minneapolis, Minnesota (#48) and Tampa, Florida (#55) are not excluded.
The “national figures” of the Case-Shiller Index not very national at all.
Even on a city-by-city basis, the Case-Shiller Index gets it wrong. The index lumps disparate neighborhoods into single, city-wide results, ignoring the relative strength of one area of a city at the expense of another.
In Chicago, for example, in which home values increased 7.3% over the past 12 months, some neighborhoods have performed better than average, and others have underperformed. The Lincoln Park and Lakeview markets are different from the Wicker Park and Bucktown ones. Yet, to the Case-Shiller Index, Paulina Avenue, Melvina Avenue, and Lunt Avenue are treated the same.
Flaw 2 : Too Few “Home-Types” Included
A second Case-Shiller Index flaw is its methodology.
The index considers only “repeat sales” of the same home in its findings, and those homes are required to be single-family, detached properties. Condominiums, multi-family homes, and new construction are not included.
In some cities, “excluded” property types can account for a large percentage of total monthly sales. New York City meets this criteria with its heavy concentration of condos and co-ops, as does Chicago, Boston, and, to a lesser extent, Los Angeles whose footprint extends into Orange County.
In Boston, condos increased in value by 10.3% as compared to 7.5% for the single-family homes. With its limited property type set, Case-Shiller captures just a portion of the overall housing market.
Click here to check today's mortgage rates
.
Flaw 3 : Too Aged To Be Accurate
The Case-Shiller Index is also flawed by “age”.
Because Standard & Poor’s publishes on a 60-day delay, the Case-Shiller Index is reporting on a housing market that no longer exists. And, it’s not a 60-day delay, even — it’s more like 6 months.
Consider that home sales tracked by the Case-Shiller Index are closed in September and based on purchase contracts which were written as many as 90 days prior. This means that the index is reporting upon sales “made” in June — half a year ago!
In June, the housing market looked different. Mortgage rates were different, consumer sentiment was different, and the summer buying season was entering its peak.
Historical data like this helps economists and policy-makers understand the long-term trends of U.S. housing, but it does little to help today’s buyers and sellers who want accurate, real-time information.
The Case-Shiller Index cannot provide that.
How Much Home Can You Afford?
If you plan to buy a home within the next 12 months, the Case-Shiller Index won’t be your “real-time” indicator of what’s happening in real estate, but it does do a good job of highlighting the broad housing trend toward rising values.
See how much home you can afford at today’s home prices and mortgage rates. Get today’s updated rates and plug them into your budget. Getting rates is fast, free, and there’s no obligation whatsoever.
Most importantly, though, mortgage rates are real-time.
Time to make a move? Let us find the right mortgage for you
.
