FIDO Score™: Where does your city rank?
You’ve probably heard of FICO scores — the credit rating lenders use to determine your mortgage eligibility. But have you heard of FIDO ScoresTM?
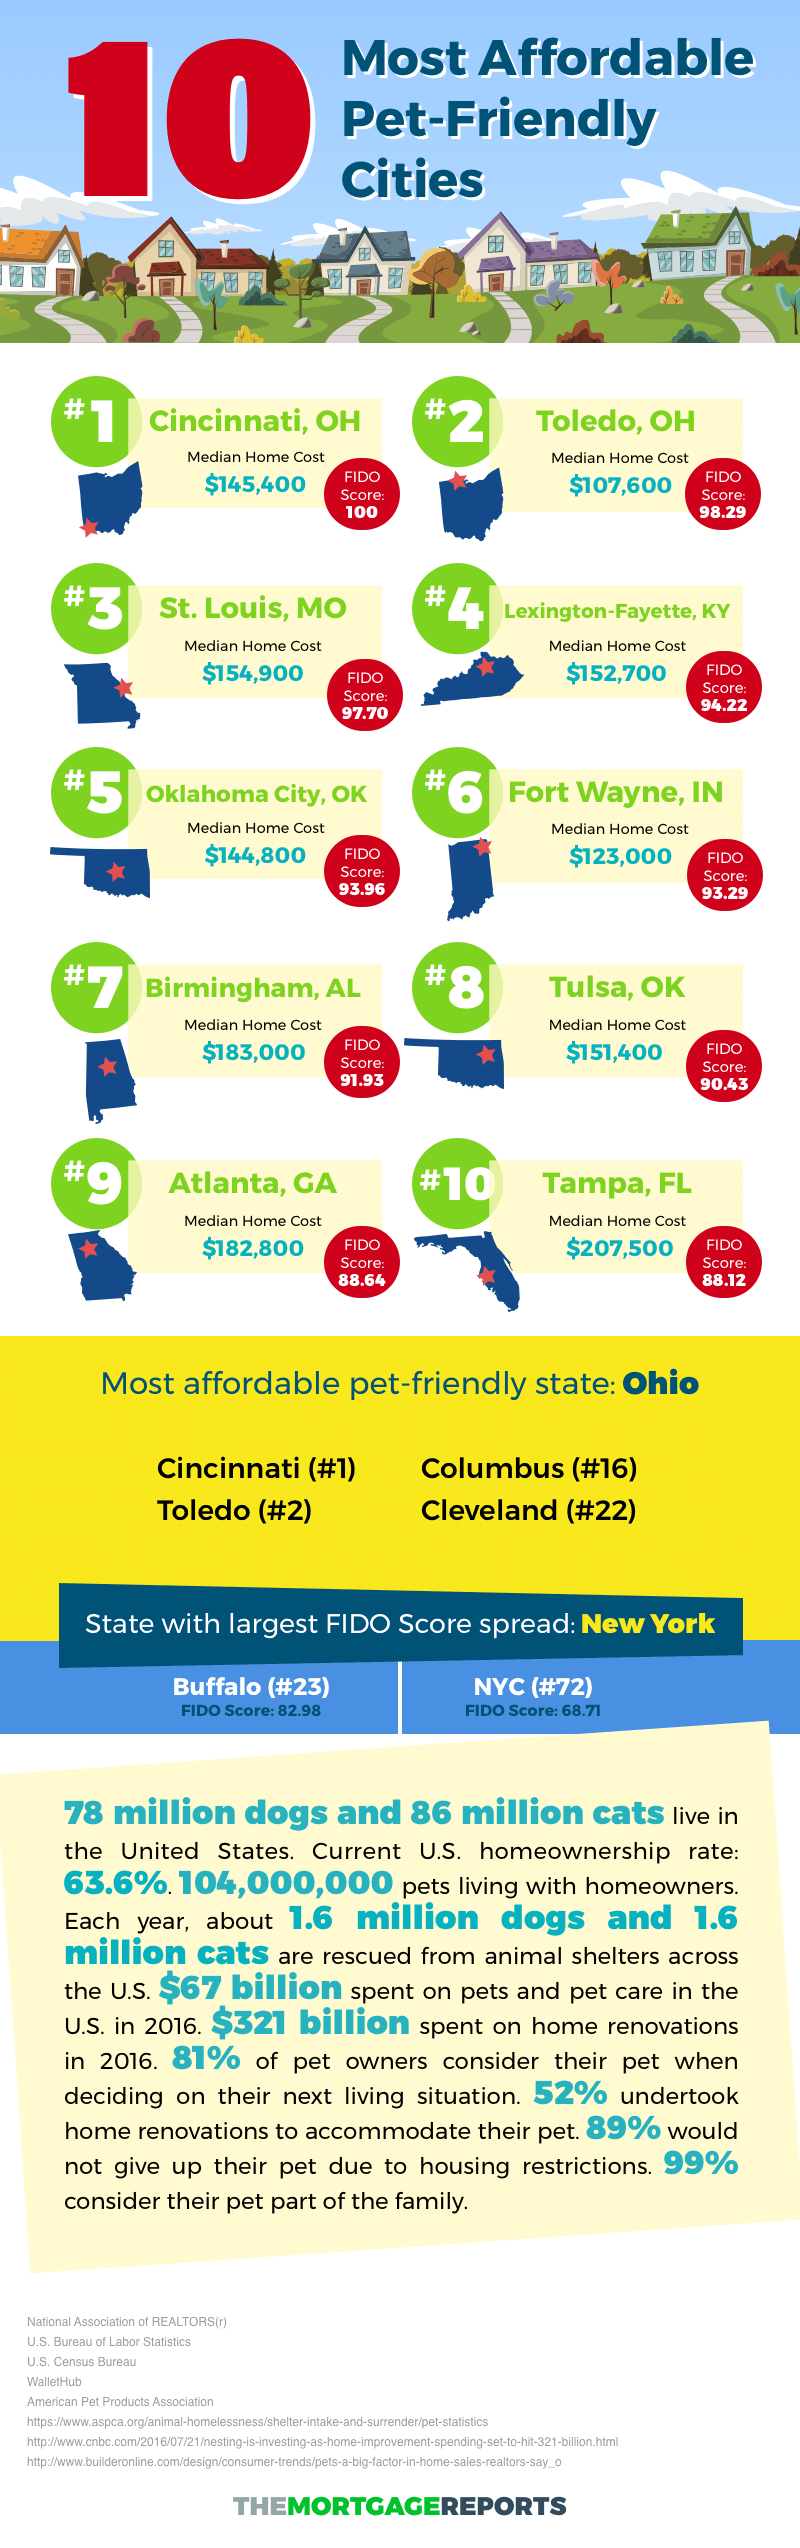
A FIDO Score™ is the measurement of a city’s pet-friendliness and home affordability.
In every city across the country, pets are treated as family. So, pet owners want to live in an area that provides the best quality of life for your loved one — great veterinary care, off-leash parks, and even pet-friendly restaurants.
But they don’t want to break the bank to do it.
That’s why The Mortgage Reports set out to answer the question, “Which cities are both pet-friendly and home-affordable?”
We started off with data from WalletHub’s 2016 study, ranking the most pet-friendly cities. Then we added affordability data from the National Association of Realtors and the Bureau of Labor Statistics to determine FIDO Scores™ for 79 cities.
Where does your city rank?
Affordable Pet-Friendly Cities Map
Finding a pet-friendly city that’s also home-affordable...what a challenge.
We’ve made it a bit easier with this interactive map. Darker shades indicate cities with the highest FIDO Scores™.
Cities are graded on a curve. The highest-ranked city — in this case, Cincinnati, Ohio — receives a baseline score of 100. Other cities fall in line behind the number-one spot based on a formula which compares home affordability and pet-friendliness.
Find your perfect city. Happy searching!
The most affordable & pet-friendly cities
| City | The Mortgage Reports FIDO Score™ Rank | The Mortgage Reports FIDO Score™ | WalletHub Pet-Friendly Rank | WalletHub Pet-Friendly Score | Median Home Price | Median Annual Income | Income-to- Home-Price Ratio (IHPR) |
|---|---|---|---|---|---|---|---|
| Cincinnati, OH | 1 | 100.0 | 8 | 57.43 | $145,400 | $48,130 | 33.1% |
| Toledo, OH | 2 | 98.3 | 40 | 49.24 | $107,600 | $43,430 | 40.4% |
| St. Louis, MO | 3 | 97.7 | 10 | 56.97 | $154,900 | $48,240 | 31.1% |
| Lexington-Fayette, KY | 4 | 94.2 | 4 | 60.94 | $152,700 | $43,620 | 28.6% |
| Oklahoma City, OK | 5 | 94.0 | 16 | 55.15 | $144,800 | $45,280 | 31.3% |
| Fort Wayne, IN | 6 | 93.3 | 42 | 49.04 | $123,000 | $42,250 | 34.3% |
| Birmingham, AL | 7 | 91.9 | 2 | 63.11 | $183,000 | $46,440 | 25.4% |
| Tulsa, OK | 8 | 90.4 | 33 | 51.01 | $151,400 | $44,840 | 29.6% |
| Atlanta, GA | 9 | 88.6 | 14 | 55.61 | $182,800 | $50,720 | 27.7% |
| Tampa, FL | 10 | 88.1 | 3 | 62.51 | $207,500 | $45,510 | 21.9% |
| Baton Rouge, LA | 11 | 87.9 | 11 | 56.86 | $169,300 | $44,460 | 26.3% |
| Lincoln, NE | 12 | 87.3 | 23 | 52.36 | $160,200 | $44,500 | 27.8% |
| Greensboro, NC | 13 | 87.2 | 36 | 49.94 | $147,000 | $42,680 | 29.0% |
| Omaha, NE | 14 | 87.2 | 30 | 51.25 | $164,600 | $46,490 | 28.2% |
| Louisville, KY | 15 | 87.1 | 29 | 51.27 | $157,700 | $44,270 | 28.1% |
| Columbus, OH | 16 | 85.8 | 50 | 47.27 | $170,700 | $48,850 | 28.6% |
| Wichita, KS | 17 | 85.6 | 74 | 42.98 | $101,600 | $43,280 | 42.6% |
| Albuquerque, NM | 18 | 85.1 | 20 | 53.98 | $189,300 | $45,920 | 24.3% |
| Kansas City, MO | 19 | 85.0 | 49 | 47.48 | $179,000 | $48,900 | 27.3% |
| Durham, NC | 20 | 84.9 | 32 | 51.15 | $228,800 | $57,850 | 25.3% |
| Pittsburgh, PA | 21 | 83.7 | 21 | 53.40 | $209,000 | $47,360 | 22.7% |
| Cleveland, OH | 22 | 83.2 | 76 | 42.11 | $126,100 | $48,250 | 38.3% |
| Buffalo, NY | 23 | 83.0 | 72 | 43.13 | $125,900 | $46,390 | 36.8% |
| New Orleans, LA | 24 | 82.7 | 38 | 49.30 | $186,400 | $43,410 | 23.3% |
| Minneapolis, MN | 25 | 82.3 | 48 | 47.78 | $234,700 | $55,010 | 23.4% |
| Tucson, AZ | 26 | 82.1 | 35 | 50.34 | $202,700 | $44,560 | 22.0% |
| Winston-Salem, NC | 27 | 80.8 | 59 | 45.77 | $145,100 | $44,100 | 30.4% |
| Scottsdale, AZ | 28 | 78.8 | 5 | 60.31 | $237,900 | $47,540 | 20.0% |
| Orlando, FL | 29 | 78.6 | 1 | 63.42 | $230,000 | $43,060 | 18.7% |
| Memphis, TN | 30 | 78.2 | 68 | 44.30 | $150,100 | $42,940 | 28.6% |
| Colorado Springs, CO | 31 | 77.3 | 7 | 57.92 | $266,100 | $49,450 | 18.6% |
| Boise, ID | 32 | 77.1 | 12 | 56.11 | $207,700 | $43,040 | 20.7% |
| Las Vegas, NV | 33 | 76.9 | 9 | 57.31 | $240,300 | $43,480 | 18.1% |
| Madison, WI | 34 | 76.3 | 22 | 53.37 | $251,300 | $50,830 | 20.2% |
| Corpus Christi, TX | 35 | 76.2 | 60 | 45.14 | $184,400 | $43,810 | 23.8% |
| El Paso, TX | 36 | 76.1 | 77 | 41.37 | $146,700 | $37,440 | 25.5% |
| Virginia Beach, VA | 37 | 75.6 | 62 | 45.05 | $206,500 | $46,470 | 22.5% |
| Henderson, NV | 38 | 75.6 | 13 | 55.78 | $240,300 | $43,480 | 18.1% |
| Raleigh, NC | 39 | 75.2 | 45 | 48.20 | $250,300 | $50,410 | 20.1% |
| Charlotte, NC | 40 | 75.2 | 79 | 41.00 | $209,600 | $49,600 | 23.7% |
| Jacksonville, FL | 41 | 75.1 | 58 | 45.93 | $215,000 | $45,140 | 21.0% |
| Arlington, TX | 42 | 75.1 | 61 | 45.10 | $236,500 | $50,350 | 21.3% |
| Phoenix, AZ | 43 | 75.1 | 47 | 47.98 | $237,900 | $47,540 | 20.0% |
| Indianapolis, IN | 44 | 75.1 | 84 | 40.72 | $159,200 | $46,840 | 29.4% |
| Fort Worth, TX | 45 | 75.1 | 64 | 44.88 | $236,500 | $50,350 | 21.3% |
| San Antonio, TX | 46 | 74.9 | 75 | 42.13 | $202,600 | $45,210 | 22.3% |
| Austin, TX | 47 | 74.7 | 28 | 51.70 | $286,400 | $50,830 | 17.7% |
| Milwaukee, WI | 48 | 74.7 | 78 | 41.09 | $221,000 | $49,350 | 22.3% |
| Sacramento, CA | 49 | 74.4 | 24 | 52.11 | $319,700 | $54,690 | 17.1% |
| Mesa, AZ | 50 | 74.3 | 69 | 43.99 | $237,900 | $47,540 | 20.0% |
| Nashville, TN | 51 | 74.2 | 70 | 43.98 | $232,200 | $45,780 | 19.7% |
| Portland, OR | 52 | 73.7 | 18 | 54.36 | $359,900 | $53,960 | 15.0% |
| Seattle, WA | 53 | 73.3 | 27 | 51.77 | $422,100 | $63,300 | 15.0% |
| Houston, TX | 54 | 73.1 | 86 | 40.06 | $222,300 | $52,870 | 23.8% |
| Reno, NV | 55 | 73.0 | 6 | 60.01 | $320,300 | $45,210 | 14.1% |
| Chicago, IL | 56 | 72.7 | 92 | 38.07 | $228,600 | $54,340 | 23.8% |
| Baltimore, MD | 57 | 72.7 | 90 | 38.77 | $237,600 | $54,920 | 23.1% |
| Philadelphia, PA | 58 | 72.6 | 96 | 34.63 | $209,000 | $53,590 | 25.6% |
| Miami, FL | 59 | 72.3 | 51 | 46.91 | $318,000 | $46,160 | 14.5% |
| Dallas, TX | 60 | 72.2 | 87 | 39.33 | $236,500 | $50,350 | 21.3% |
| Denver, CO | 61 | 71.2 | 34 | 50.61 | $396,100 | $55,910 | 14.1% |
| Riverside, CA | 62 | 70.8 | 57 | 45.96 | $326,500 | $46,820 | 14.3% |
| Aurora, CO | 63 | 70.5 | 66 | 44.34 | $396,100 | $55,910 | 14.1% |
| Jersey City, NJ | 64 | 70.4 | 91 | 38.60 | $386,000 | $61,790 | 16.0% |
| San Bernardino, CA | 65 | 70.2 | 80 | 40.96 | $326,500 | $46,820 | 14.3% |
| Newark, NJ | 66 | 70.0 | 95 | 36.31 | $386,000 | $59,890 | 15.5% |
| Boston, MA | 67 | 69.6 | 98 | 33.50 | $414,200 | $64,080 | 15.5% |
| Long Beach, CA | 68 | 69.6 | 63 | 45.00 | $485,800 | $55,650 | 11.5% |
| San Diego, CA | 69 | 69.4 | 37 | 49.41 | $564,000 | $55,480 | 9.8% |
| Chula Vista, CA | 70 | 69.1 | 55 | 46.27 | $564,000 | $55,480 | 9.8% |
| San Francisco, CA | 71 | 69.0 | 53 | 46.36 | $815,000 | $76,160 | 9.3% |
| New York, NY | 72 | 68.7 | 100 | 24.49 | $386,000 | $63,320 | 16.4% |
| Oakland, CA | 73 | 68.3 | 56 | 46.12 | $815,000 | $62,760 | 7.7% |
| Los Angeles, CA | 74 | 68.2 | 93 | 36.70 | $485,800 | $55,650 | 11.5% |
| Irvine, CA | 75 | 68.2 | 65 | 44.48 | $750,000 | $55,890 | 7.5% |
| San Jose, CA | 76 | 67.4 | 85 | 40.31 | $1,070,000 | $78,990 | 7.4% |
| Anaheim, CA | 77 | 67.2 | 94 | 36.41 | $750,000 | $55,890 | 7.5% |
| Honolulu, HI | 78 | 67.2 | 89 | 39.12 | $746,000 | $51,080 | 6.8% |
| Santa Ana, CA | 79 | 67.0 | 99 | 31.03 | $750,000 | $55,890 | 7.5% |
Methodology
FIDO Scores™ are highest in cities that are both pet-friendly and affordable.
Pet-friendliness is determined using a score from a 2016 WalletHub study which examines 19 metrics in 100 cities — everything from veterinary care costs to the number of pet-friendly hotels.
Affordability is determined by comparing an area’s median income with its median home price to come up with an Income-to-Home-Price Ratio, or IHPR. For instance, if the average home price is $100,000, and you make $25,000 per year, the IHPR is 25%.
The higher the IHPR, the more home-affordable the city.
The base “affordable/pet-friendly” score was determined by multiplying WalletHub’s pet-friendly score with IHPR.
Then, for ease of understanding, the top-ranked metro in home affordability and pet-friendliness combined was given a benchmark score of 100 (in this case, Cincinnati, Ohio). Other cities are graded on a curve behind the number-one spot based on the following formula:
100 - (top base score - [Pet-friendly score x IHPR x bonus and/or penalty])
The bonus/penalty system is necessary because some cities were quite pet-friendly, but were not very affordable. Others were ultra-affordable, but scored low on WalletHub’s pet-friendly rank.
Ranking cities purely by a standard weighting system resulted in strange results. For instance, Wichita, Kansas gets high marks by affordability standards. But it’s WalletHub’s 74th most friendly city — not very pet-friendly. A standard weighting system, for instance, 70% weight on home price and 30% weight on pet friendliness, would put Wichita in the #2 spot on the Affordable/Pet-friendly list. The bonus/penalty system pulled the city down to 17th.
Therefore, cities that were above the 50th percentile in both pet-friendliness and affordability received a bonus of 150% of their original score.
An additional 10% bonus was given to the top 10 pet-friendly cities and the top 10 affordable cities.
Cities below the 20th percentile in both categories were given a 20% penalty. This prevented cities that were ultra-pet-friendly but not affordable (or vice-versa) from achieving a high rank. After all, the study intends to surface affordable and pet-friendly all-stars in the group.
The result is the FIDO Score™: a measurement of the best places to live for pet lovers who don’t want to spend a mint on a house.
Oh, and you might be wondering what "FIDO" in FIDO Score™ stands for. Drop us a line and let us know your suggestion. We'll update this page with the best idea, up to and including posting a picture of you and your furry loved one dead-center on our page!
Sources:
WalletHub’s 2016 Most Pet-Friendly Cities https://wallethub.com/edu/most-pet-friendly-cities/5562/
Bureau of Labor Statistics May 2016 Metropolitan and Nonmetropolitan Area Occupational Employment and Wage Estimates https://www.bls.gov/oes/current/oessrcma.htm
National Association of REALTORS Metropolitan Median Area Prices and Affordability 2017 Q1 https://www.nar.realtor/topics/metropolitan-median-area-prices-and-affordability